Demography is Destiny
The children filling classrooms in 2026 will be the voters, workers and parents of the 2060s. The latest statistics from the Department for Education show a country being remade from the bottom up. White British…
Learn More
The Death of Henry Nowak
Much has been written and said about the tragic murder of young Henry Nowak and the sentencing of his killer, Vickrum Digwa, by politicians such as Kemi Badenoch, Nigel Farage, Nick Timothy, and Lord Frost.…
Learn MoreThe public have spoken. They agree migration is out of control.
For 25 years, Migration Watch UK has made the case that net migration to this country has reached levels the public never asked for and the country cannot sustain. We have published the research, engaged…
Learn More
Democracy At Work
While the votes are still being counted in some areas of the country, the message from Thursday’s elections, especially in England and Wales, is unmistakable. The voters have delivered their verdict on the political establishment:…
Learn More
The Dream Is Dead – Europe Admits Mass Migration Has Failed
For decades, there were activists, academics and politicians on the Continent who looked at Britain, rolled their eyes and tutted. The thought us insular - well, we are an island. We were too attached to our…
Learn More
Britain “Grinds to a Halt” – The Real Cost of Mass Migration
There was a time when economists and politicians told us “Britain would grind to a halt” without migrant workers. We were told immigrants would pay their own way, earn more than British-born workers, fund our…
Learn More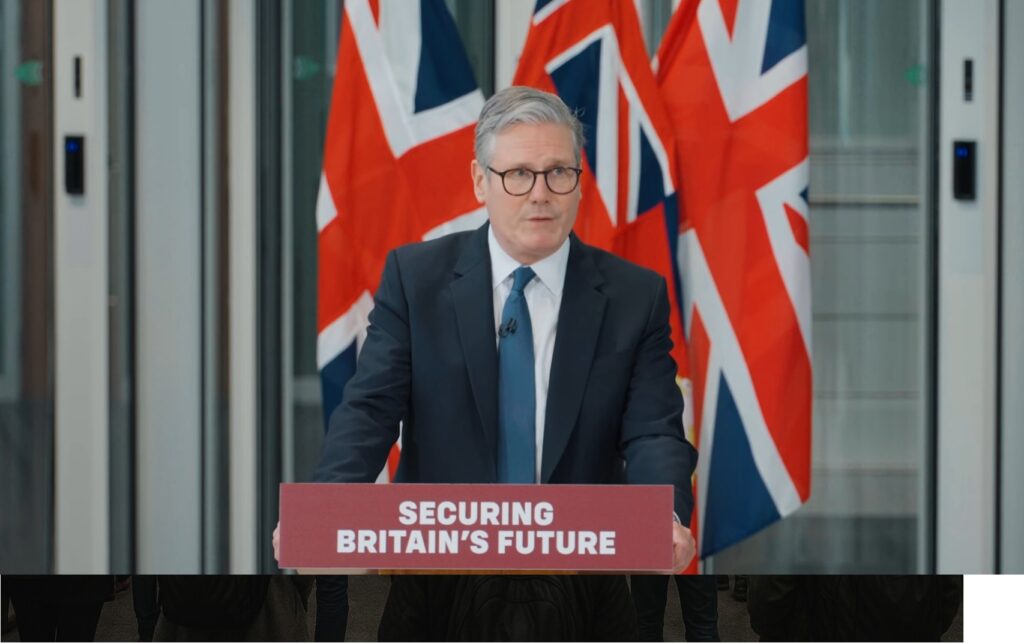
Both Conservatives and Labour; the public on immigration. New research shows neither party will stop UK population hitting 70 million
As the latest immigration Bill comes to the House of Commons on Tuesday for its final approval, new research published today shows that the immigration policies of neither the Conservative Party nor the Labour Party…
Learn More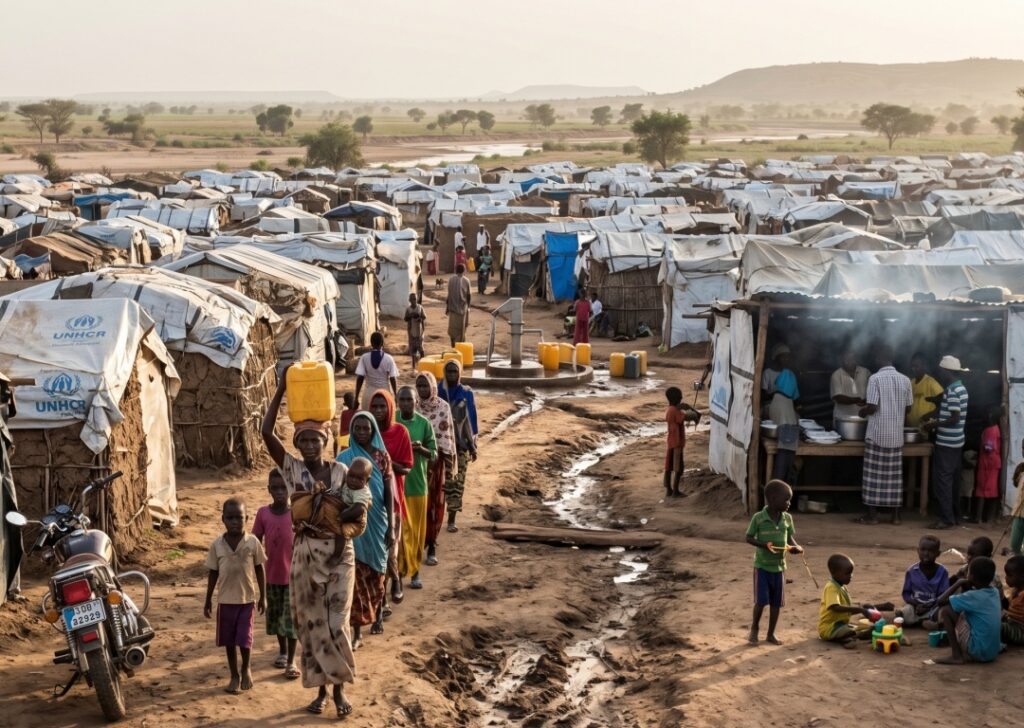
Africa’s Forgotten Crisis Risks New Asylum Wave
In the two or three years prior to the 2015/16 deluge of asylum seekers, the EU, of which Britain was still a part, should have known that a mass movement of people would follow upheaval…
Learn MoreMigration Watch Responds To The Latest Set Of Ons Migration Figures, September 2025
Migration Watch Chairman, Alp Mehmet, said: “At last we have a political party that acknowledges the gravity of the situation. Immigration is now the sole driver of our massive and rapid population growth. It simply…
Learn More
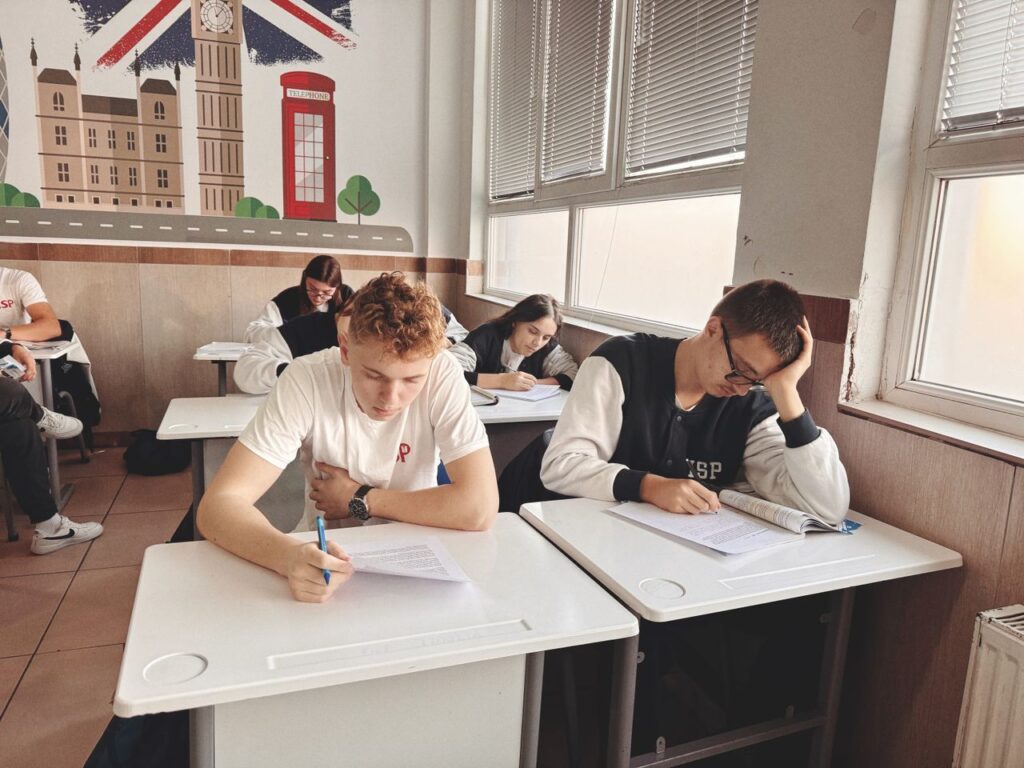
Demography is Destiny
The children filling classrooms in 2026 will be the voters, workers and parents of the 2060s. The latest statistics from the Department for Education show a country being remade from the bottom up. White British pupils now account for less than 60% of the state-school population, down from around 70%

The Death of Henry Nowak
Much has been written and said about the tragic murder of young Henry Nowak and the sentencing of his killer, Vickrum Digwa, by politicians such as Kemi Badenoch, Nigel Farage, Nick Timothy, and Lord Frost. The brilliant Douglas Murray also devoted his column in The Spectator to Henry Nowak. I
The public have spoken. They agree migration is out of control.
For 25 years, Migration Watch UK has made the case that net migration to this country has reached levels the public never asked for and the country cannot sustain. We have published the research, engaged the politicians, and put the evidence in front of anyone willing to look. And for

Democracy At Work
While the votes are still being counted in some areas of the country, the message from Thursday’s elections, especially in England and Wales, is unmistakable. The voters have delivered their verdict on the political establishment: “we have had enough of you”.
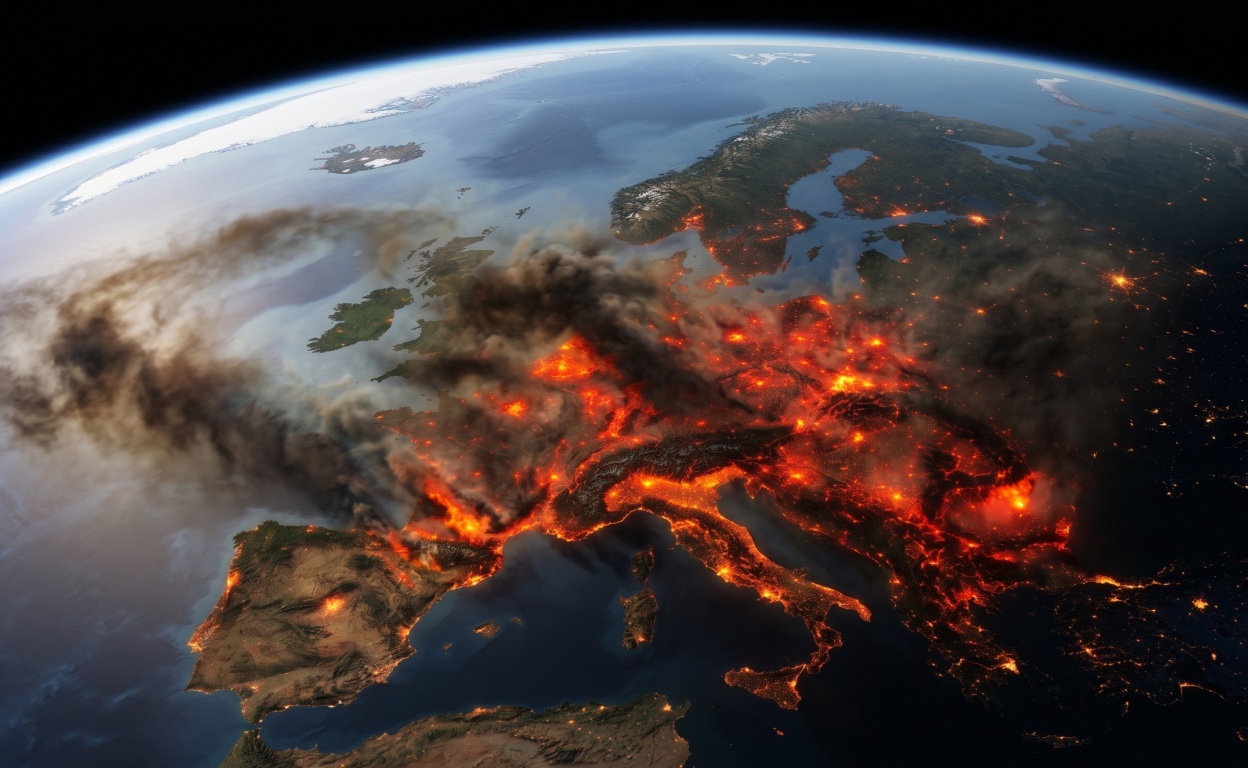
The Dream Is Dead – Europe Admits Mass Migration Has Failed
For decades, there were activists, academics and politicians on the Continent who looked at Britain, rolled their eyes and tutted. The thought us insular – well, we are an island. We were too attached to our own history and identity, we banged on about the Second World War, defeating Hitler

Britain “Grinds to a Halt” – The Real Cost of Mass Migration
There was a time when economists and politicians told us “Britain would grind to a halt” without migrant workers. We were told immigrants would pay their own way, earn more than British-born workers, fund our pensions and strengthen our public services. Those arguments are dying.