The Office for National Statistics has produced experimental research which estimated that net immigration from overseas to the UK in the year to June 2020 was just over 282,000. Here are the key takeaways of the experimental and provisional research methodology which the ONS hopes to deploy for future estimates:
- Total net migration was 282,000 about 75,000 than 207,000 in the previous year 207,000.
- All net non-UK arrivals were accounted for by those from outside the EU. Against non-EU net migration of just over 282,000, the ONS said there was a net departure of EU citizens totalling 3,800.
- There looks to have been a net inflow of just under 3,700 British citizens for the first time in recent memory (in contrast with a usual net departure of Brits to other parts of the world running at about 60,000 per year). See the full ONS figures based on what the ONS calls experimental innovative methodological research on estimating international migration which is being used in the development of future Admin-Based Migration Estimates.
The ONS arrived at these figures using modelled estimates based upon various administrative data. It stresses that they ‘are provisional as models develop and will be subject to retrospective confirmation and adjustment as data become available or mature’.
They are the first headline net migration figures that we have had covering the peak period of the Covid pandemic in the late Spring and early Summer of 2020.
The ONS separately estimated that the UK population continued to grow during 2020 and hit a record 67 million for the first time ever, increasing by over 310,000 in the space of a year.
A net overseas immigration level of 282,300 in the year to June 2020 would be 75,000 higher than the ONS’s net migration figure for the previous year (2018/19) of 207,000. Below is a summary of these estimates. The comparative cumulative net migration estimates for the three most recent years can also be seen in the ONS graph below.
- Overall: +282,300
- British: +3,000
- European Union: – 3,800
- Non EU: +282,500
In a separate release in April 2021, the ONS issued new figures which suggested it may have under-counted gross non-UK immigration by just under 1.4 million since 2011, and overall non-UK net immigration by nearly 400,000 during the same period (see the new statistics).
The ONS looked back at immigration figures for the period 2011 to 2020 – comparing the statistics as they were recorded under the previous system for measuring migration (Long-term international migration – LTIM – estimates that were based primarily upon the International Passenger Survey or IPS – a survey taken at airports which was in place from the 1960s until 2020) against a newer experimental method which focuses on administrative data.
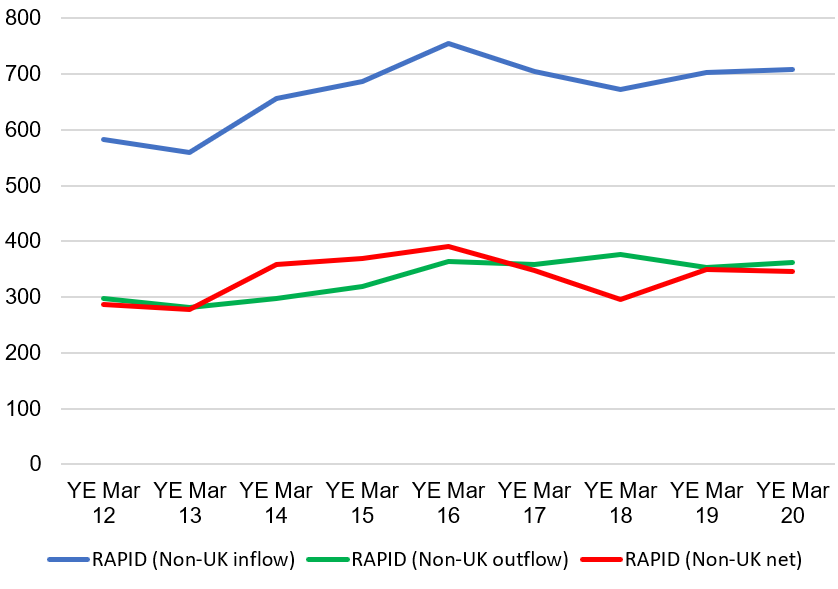
This latter method is called the Registration and Population Interaction Database (also known as RAPID) and is based in data on National Insurance Number registrations (NINos) by non-UK nationals held by the Department for Work and Pensions (DWP) and HM Revenue and Customs (HMRC); alongside Home Office Border data derived primarily from Exit Checks.
If the new method is indeed more accurate, then it suggests that the ONS under-counted net non-UK migration overall, with an 840,000 under-count of net EU arrivals net counterbalanced against an over-count (by 490,000) of non-EU net arrivals. Here is a summary of the adjusted figures:
- Total non-UK immigration under RAPID was nearly 1.4 million higher – averaging 670,000 per year during the nine-year period 2011 to 2020 compared to 519,000 under LTIM. The total difference is just under 1.4 million over the nine-year period. The biggest gap was 200,000 in 2016, pointing to the previous underestimation of EU arrivals. RAPID suggests much higher EU immigration but lower non-EU immigration.
- Non-UK emigration under RAPID was judged to be 975,000 higher than under LTIM – averaging 334,000 per year compared to 226,000 under LTIM. RAPID suggests higher emigration by both EU and non-EU citizens.
- Non-UK net migration under RAPID was 386,000 higher than under the other method – averaging 336,000 per year compared to 293,000 under LTIM (43,000 more per year). Overall, RAPID suggests that EU net migration was 840,000 higher than LTIM during the whole period 2011-20 but that non-EU net was 490,000 lower.
Why did the experimental method find that net EU immigration was higher than the previous LTIM method suggested? According to the ONS: “One of the main drivers… is likely to be the uncertainty of these migrants in their intentions to move to and from the UK. This makes it difficult to measure their migration patterns using the IPS. This suggests that differences between IPS figures and RAPID may be related to RAPID being based on actual observed patterns of behaviour.”
And why did it find that net non-EU immigration was lower? The ONS states: “One of the main drivers for the lower estimates of non-EU net migration based on RAPID is likely to be the measurement of students migrating to and from the UK.”
What is the significance of the suggested over-count of non-EU immigration by the previous LTIM method?
It has been suggested by some that, if EU net immigration has indeed been higher than previously thought, and non-EU net immigration lower, this would mean that the government was wrong between 2010 and 2020 to focus on reducing net migration to less than 100,000 per year. This is, of course, nonsense.
The UK has experienced rapid population growth of over 400,000 per year since 2001 (over 80% of it driven by immigration directly or indirectly). This level of immigration is seen as much too high by most of the public (according to a recent YouGov poll). Immigration on this massive scale has driven down our quality of life in part by increasing demand for accommodation in the midst of a major housing crisis as well as greatly adding to pressure to build on green space (60 square miles of supposedly protected green belt land has been set aside for bulldozing by local authorities since 2015). Poorly-controlled immigration has added to congestion and overcrowding on roads and other transport networks, while the failure to control and enforce our borders effectively is deeply concerning for a range of reasons related to public safety but also cohesion and pressure on public services.
It is not surprising that the target to reduce net migration to the tens of thousands (from then well over 200,000 per year) was supported by nearly three-quarters of the public in mid-2018 (Deltapoll).
If non-EU migration was lower than previously thought then would it mean that the Cameron and May Governments were wrong to attempt (albeit unsuccessfully) to reduce net migration to the tens of thousands? The critics suggest this because such efforts were primarily directed at non-EU numbers – which have now allegedly been shown to be lower – as free movement from Europe at the time tied their hands on tackling that element of immigration.
Not at all.
Non-EU immigration overall has been more costly for the country from a number of perspectives than EU immigration. Analysis by Oxford Economics (and published by the official expert committee on immigration – the Migration Advisory Committee) found that non-EU migrants were a huge overall net fiscal cost for the country of £9bn in 2016/17 (unlike EU migration which was a clear net fiscal benefit), non-EU immigration is more dominated by family/study/asylum while EU immigration has been more focused on work (something which helps enable better integration), and non-EU immigration is a source of much greater cohesion and public safety challenges than EU migration.
Figure 1: Net immigration of foreigners as measured under the previous LTIM method and under the provisional administrative-based migration estimates data (RAPID).
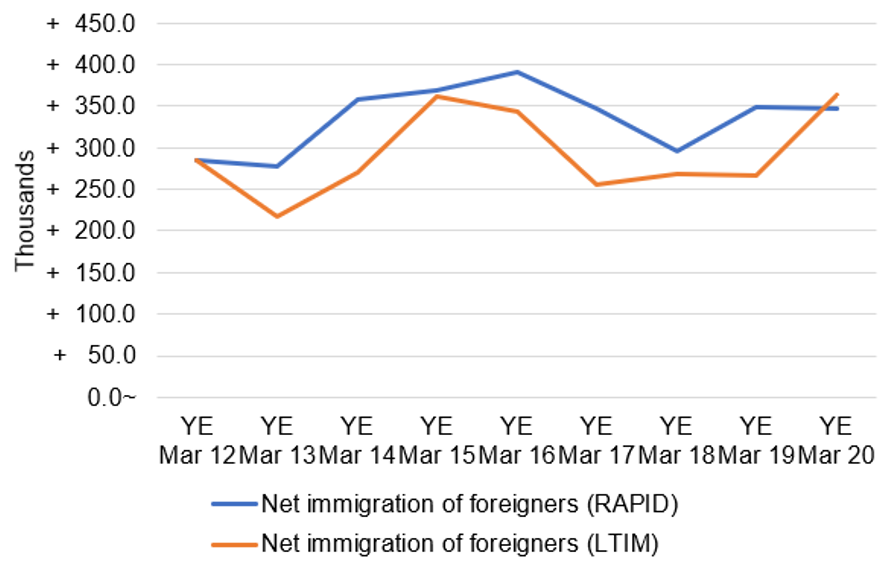
Figure 2: Net non-UK immigration under older measurement system based upon the International Passenger Survey (ONS figures, April 2021).
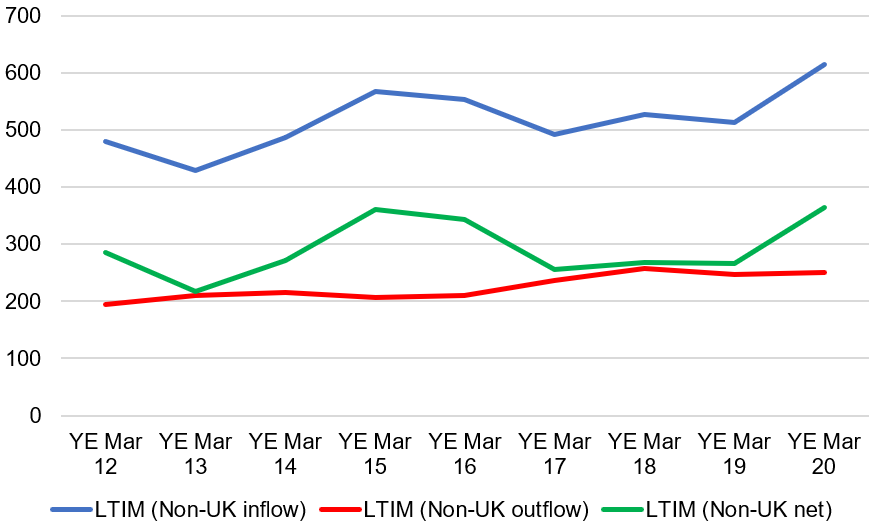
Figure 3: Net non-UK immigration under the new experimental RAPID system, based upon measurement of administrative data. (ONS figures, April 2021).