The Effect of Immigration on the Regions
9 February, 2005
Summary
1. There has been an extraordinarily rapid change in London's population over the past ten years. In the period 1993-2002, 606,000 more Londoners moved out of the city than came to it from elsewhere in the UK. In the same period a net 726,000 immigrants arrived in London.
2. The outward migration of Londoners to other regions of the UK has accelerated as immigration has increased. In 2003 alone there was a net outflow from London of over 114,000 to the rest of the UK.
3. Migration within the UK is mainly from areas of high ethnic minority population to those with predominantly white populations. . The effect is a rapid increase in the ethnic minority composition of some boroughs, resulting from an outflow of the white population and an inflow of African and Asian international migrants. This is accentuated by demographic factors such as the age distribution and fertility rates of some ethnic minority groups. Overall, the result is that the white population of the UK and the ethnic minority population are becoming increasingly separated.
4. This has serious implications for the integration of new immigrants and for the provision of public services, such as health, education and social services in the areas concerned. This study therefore reinforces the concerns expressed by the Cohesion Panel which reported to the government in July 2004 that "the pace of change (for a number of reasons) is simply too great in some areas at present." Obviously, the pace and geographical concentration of immigration, highlighted by this study, is a major factor.
5. For the Regions receiving the outflow of population from London, the result is a rapid population increase and pressures on infrastructure - particularly housing , transport, health and environment.
Detail
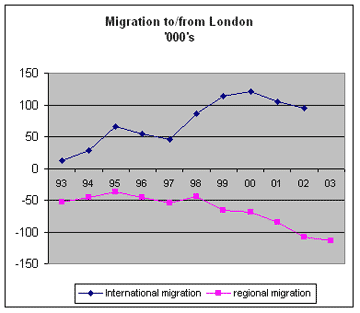
6. Historically, there has tended to be a population shift from Scotland and the North of England to the South. No longer. In fact, over the period 1993-2002, there has been a tiny net inflow of people from the rest of the UK to Scotland, rising to 13,000 in 2003.
7. The main movement of people within the UK has been from London to other parts of Southern and Eastern England as the following map shows[1] . People have also moved out of the North East, North West and the West Midlands.
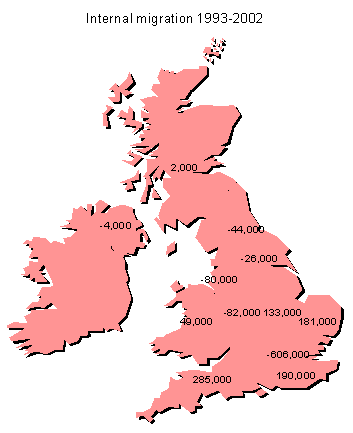
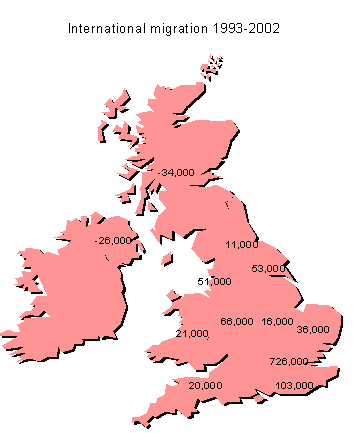
8. In contrast international migration flows have been primarily to the areas which have high existing ethnic minority populations. The following map shows the destination of international migrants to/from Scotland, Wales and Northern Ireland and the English Regions for the 10 year period 1993-2002 inclusive[2] . As can be seen there have been small net outflows of people from Scotland and Northern Ireland. London has been the destination of the majority of immigrants with almost three-quarters of a million net immigrants arriving during the period. There have also been net inflows to the other English regions and to Wales. The smallest net flows have been to the South West and to the North East regions which have the smallest ethnic minority populations[3].
9. Immigration is, of course, not the only determinant of the inter-regional migration flows. For many years there has been a movement of people from the industrial parts of the UK to the less densely populated, less urbanised areas. However, this movement has accelerated as the pace of international immigration has accelerated in the last few years as the following chart for London demonstrates[4]. (Negative numbers illustrate net migration out of London and positive numbers net migration into London).
10. An analysis of data for mid-1999 to mid-2003[5] by age groups of migrants shows that, in this 4 year period, there was a net outflow of nearly 150,000 people from London to the rest of the UK in the 25 to 44 age group. There was also a net outflow of about 125,000 children aged under 16. This suggests that young couples with children, or wanting to start a family, seek to move away from London. Anecdotal evidence suggests that one of the considerations may be education which, with the large concentrations of ethnic minority children in some London boroughs (many of whom have parents who have recently arrived in the UK), may be a cause of concern. Whatever the reasons, the movement of so many people of this age group from London is a major problem. Established families are the bedrock of a stable society. 150,000 people represents about 6% of the 25 to 44 age group leaving London in just 4 years. A second issue is that many of this group will continue to work in London contributing to the rise in commuting. According to the Prime Minister's Strategy Unit commuting is expected to rise by 10% to 20% from 2003 to 2010[6].
11. The following chart shows the net movements of people by age to/from London over the 4 years from mid-1999 to mid-2003. (Negative numbers represent movements from London).

12. Migration from London to the rest of the UK is generally highest for those London boroughs which have the highest ethnic minority populations as the following chart shows[7].
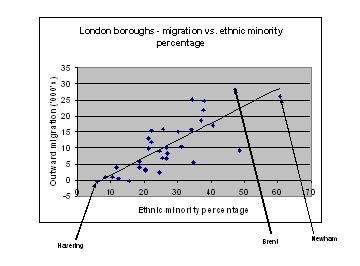
13. The two boroughs with the highest net outflow of population to the rest of the UK are Brent and Newham respectively. In the case of Brent, the white population has fallen from 136,600 (58% of the population) in 1991 to 122,400 (46% of the population) in 2001[8]. In the case of Newham, the white population has fallen from 124,100 (58% of the population) in 1991 to 99,300 (41% of the population) in 2001 . The changes are partly caused by demographic factors (higher birth rates in some ethnic minority communities and a younger age profile) but they also result from the increasingly large flows of international immigrants, from Asia and Africa, into London and the resulting high flows of migrants from these boroughs to the rest of the UK. This has the effect of increasing the concentration of ethnic groups in particular areas, making integration more difficult. In contrast, in Havering internal UK migration into and out of the borough is virtually in balance and the borough remained predominantly (nearly 96%) white in 2001 - a small change on 1991 when it was about 97% white.
14. In the four Regions, South-West, South-East, East and East Midlands, which have seen the largest net inflows of internal migrants over the past 10 years, the population increase has been driven primarily by this migration. The following chart shows the relative importance of the 2 factors which drive population change: natural increases, i.e. the difference between births and deaths, and migration (both internal and international)[9]. As demonstrated in paragraphs 7 and 8 this is largely internal migration.
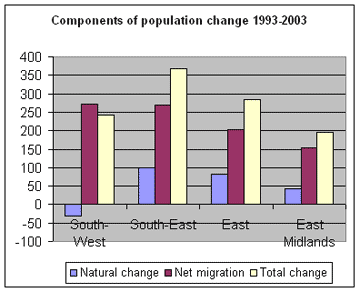
15. With the exception of the South-East nearly all the migration component is internal movements of people from the rest of the UK to these Regions. Its effect is to rapidly increase the Regions' populations. The population of the South-West Region has, for instance, increased by 5.6% between 1993 and 2003 [10]. It would have declined slightly if there had been no migration. One of the main impacts is, of course, on the need for new housing - population increase together with the move to smaller households size is a key driver of housing demand.
16. The overall impact of these internal and international flows of people has been to rapidly increase the minority ethnic population of those regions which had a large ethnic minority population in 1991. In contrast the white population of these regions has declined. The regions which have seen an increase in the white ethnic group between the 1991 and 2001 censuses were those which had, and have, a small minority ethnic minority population. (The exception to this is the North-East region which has seen an overall reduction in its population). The following graph shows the approximate changes in population in the English regions between the two censuses[11].

Conclusion
16. The pace of inter-Regional migration, which is principally from London to the South-West, South-East, East and East Midlands Regions, is accelerating in line with the acceleration in the pace of international migration. Most international migrants head to London.
17. In the London boroughs there is a correlation between the rate at which the existing population is leaving the borough and the size of the ethnic minority population. In contrast the areas of the country which are receiving internal migrants are predominantly white. The effect is a rapid increase in the ethic minority composition of some boroughs, resulting from an outflow of the white population, an inflow of African and Asian international migrants and the demographic factors of age distribution and fertility rates of some ethnic minority groups. There seems to be a similar pattern in the Manchester and Birmingham areas. Overall the result is that the white population of the UK and the ethnic minority population are becoming increasingly separated.
18. The rate at which this change is taking place greatly exacerbates the difficulties of integrating immigrants into the culture of the United Kingdom. It also places enormous stress on housing, education, health and social services in immigrant areas. Meanwhile, the South-West, East, South-East and East Midlands regions are having to expand rapidly to cater for the outflow of the existing population from London - putting strains on their infrastructure, particularly housing, transport, education and health.
19. This study thus reinforces the concerns expressed by the Cohesion Panel which reported to the government in July 2004 that "the pace of change (for a variety of reasons) is simply too great in some areas at present." It is obvious from this study that the pace, scale and geographical concentration of immigration is a major factor.
Footnotes
- Source: ONS Population Trends: No. 118 Winter 2004 and No.94
- Source: ONS International Migration – Series MN29 Table 2.8
- Source: 2001 census
- Source: Regional Migration - ONS Population Trends 118 Winter 2002 table 8.1; International Migration – ONS International Migration – Series MN29 table 2.8
- Source : ONS Internal Migration - Local Authority flows by broad age group and gender for the relevant periods.
- Downing St. Strategy Unit July 2003: London Analytical Report Page 30
- Show -6 more...
- Source: ONS Population Trends: No. 118 Winter 2004 and No.94
- Source: ONS International Migration – Series MN29 Table 2.8
- Source: 2001 census
- Source: Regional Migration - ONS Population Trends 118 Winter 2002 table 8.1; International Migration – ONS International Migration – Series MN29 table 2.8
- Source : ONS Internal Migration - Local Authority flows by broad age group and gender for the relevant periods.
- Downing St. Strategy Unit July 2003: London Analytical Report Page 30
- Source: as v.
- Source: 1991 and 2001 censuses. 1991 ethnic white population increased by 1.595% to allow for the discrepancy between the 1991 census and the 1991 mid-year population estimates (overall ethnic white population in 1991 for England was 44.144m people according to the census and 44.848m people according to the mid-year population estimate). 2001 census figures adjusted to treat half of the mixed white/black Caribbean, half of the mixed white/black African and half of the mixed white/Asian populations as white. This adjustment is necessary as there was no mixed ethnic category in the 1991 census)
- Source: ONS: Components of population change for local authorities in England and Wales revised in the light of the local authority population studies.
- Ibid
- Source as in viii