2003 Population Projections
18 December, 2003
Summary
1.The Government announced their revised population projections on the 18 th December. For migration the long-term assumption is that there will be a net increase in the population each year of 103,000 people.
2.Over the last few years the population projections have consistently underestimated the actual, officially stated levels of net migration as published each year by the Office for National Statistics (ONS). The latest estimate is no exception. At 103,000 it is roughly two-thirds of the actual average levels of net migration (158,000) experienced over the last five years, according to ONS published data. The government figures take no account of failed asylum seekers who do not leave the country, nor of other illegal immigrants.
3.The projections do take account of the reduction in asylum claims experienced in 2003 but take no account of the many measures the government has taken to encourage migration - particularly the continuing massive expansion of the work permit system and the right of access of EU accession countries' citizens to the UK labour market from May 2004.
4.Migration Watch UK estimates that these measures will maintain net migration at over 150,000 into the foreseeable future and that a further 20,000 should be added to this figure to allow for the non-removal of failed asylum seekers, bringing the total to at least 170,000. This does not include any allowance for illegal immigrants.
5. Population projections based on an assumed net immigration of 103,000 people per year substantially understate the inflow as officially estimated by ONS and therefore substantially understate the level of population growth likely to be experienced by the United Kingdom , and the South-East of England in particular, in future years. They form a seriously misleading basis for considering policy on immigration and its impact on the UK , especially on the future level of housing demand.
Detail6.Every two years the government publishes projections, produced by the Government Actuary's Department, of the future population of the United Kingdom . These projections are based on a number of assumptions regarding birth rates, mortality and net migration into the U.K.
7.The population projections are widely used for planning purposes and are of critical importance. For example the Office of the Deputy Prime Minister base their projections of housing needs on the population projections. Over a 25 year period it is officially stated that a variation of + 40,000 net migrants per annum would create the need for about 450,000 new households [1].
8.These latest 2002 based population projections use a figure of 103,000 net migration into the United Kingdom each year. This figure is made up of:
a. Net migration from International Passenger Survey (adjusted for migration to Ireland and visitor switchers): |
+115,000 |
b.Asylum seekers: |
+15,000 |
c.Adjustment for unattributable population change: |
-27,000 |
d.Total net migration: |
+103,000 |
9.The 1998-based projections assumed a long-term net annual migration of 95,000 from 2001-2 onwards.
10.The 2000-based projections revised the long-term estimate upwards to 135,000 per annum. However, following the publication of the 2001 census, this was reduced to 100,000 per annum.
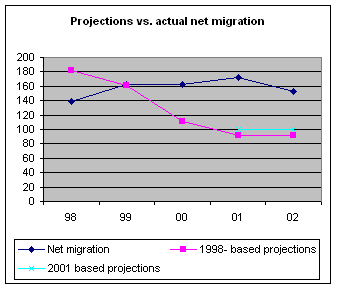
11.The following graph shows the actual figures for net migration into the UK in comparison with the 1998 and interim 2001 based estimates. It can be seen that net migration has been consistently underestimated by about 50,000 a year.
12.It should be noted that the net migration and population projections shown above do not allow for illegal immigrants.
13.The new 2002-based population estimates also significantly underestimate future migration patterns for the reasons described in paragraphs 14 to 17 below.
14.The overall figure of 103,000 net migrants per year is significantly below actual net migration figures which have averaged 158,000 over the last 5 years. Although we are seeing a fall in asylum claims in 2003 we believe that this will be compensated for by the relaxation of controls over legal migration. The key policy measures put in place by the government are:
| - | an increase in the number of work permits being issued from 30,000 in the early 1990's to an expected 175,000 in 2003 [2] |
| - | The opening up of our labour markets to the EU accession countries from May 2004. The Government's estimate for resulting migration into the UK is between 5,000 and 13,000 per annum. (We believe that this is a very conservative figure - our own estimate is at least 40,000 per annum [3].) |
| - | The changes to the working holidaymakers' scheme which has now become another route to allow full access to the UK 's labour market. |
| - | Changes to the arrangements for overseas students studying in the UK to allow those with science degrees to switch straight into work permit employment. |
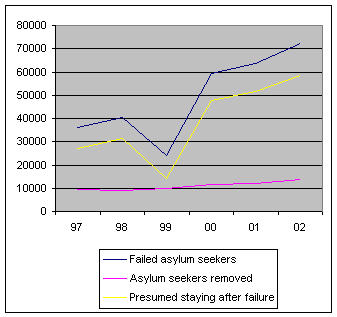
15.No allowance has been made for failed asylum seekers who remain in the country. The following graph compares the number of failed asylum seekers [4] with the number of asylum seekers removed. The difference between these two figures is represented by the yellow line and is a rough measure of failed asylum seekers who are staying in the UK . As can be seen this has been 20,000 or above for five of the last six years and well above 40,000 for the last 3 years.
16.Clearly, if the number of asylum claimants continues at the reduced levels being experienced in Q3, 2003 the number of failed asylum seekers who remain in the UK will also fall. However, we still estimate that the numbers will be in the order of 20,000 to 30,000 per annum[5].
17.Finally, as shown in paragraph 8, the government has subtracted 27,000 from the projection for 'unattributable population changes'. This adjustment is because the 2001 census did not tally with the 1991 census updated for births, deaths and migration - so migration data was considered to be too high and was reduced. However, it is becoming increasingly clear that it was the census itself which was flawed.
Conclusion18. Our view therefore is that, without a significant revision of present government policies designed to increase immigration, net migration is likely to remain at or above 170,000 per annum for the foreseeable future. Our calculation is as follows:
Government Actuary's 2002 projection (unadjusted) |
130,000 |
+ Increase attributable to work permits [6] |
10,000 |
+ Increase attributable to EU expansion [7] |
10,000 |
+ Failed asylum seekers not removed from the UK |
20,000 |
| Total | 170,000 |
This is nearly two-thirds more than the official government projections released on 18.12.2003.
Footnotes
| [1] | Housing Statistics: Projections of Households in England 2021 - Office of the Deputy Prime Minister - Table G7 |
| [2] | Source: International Migration and the U.K. |
| [3] | See Migration Watch UK research paper T - The effect of EU enlargement on migration flows at www.migrationwatchuk.co.uk |
| [4] | Failed asylum seekers is calculated as the sum of 1) those who do not appeal against an initial refusal and 2) those whose asylum applications are refused on appeal. Figures include an allowance of 30% for dependants. |
| [5] | Experience in the period 1997-2002 shows that about 37% of applicants are granted asylum or exceptional/discretionary leave. A further 13% of applicants are removed. The remaining 50% have their applications rejected but remain in the UK . Applications in Q3 2003 were running at an annual rate of just under 60,000 (including dependants). The lower figure of 20,000 allows for a substantially increased rate of removal. |
| [6] | Based on an increase in work permits of 43,000 in 2003 cf. 2002 (175,000 vs 132,000). Of these it is assumed that two-thirds (29,000) are long-term and 27% (historical comparison of work permits issued and settlement four years later) will settle in the UK . These will constitute the long-term "net" migrants. This gives just under 8000 work permit holders. Adding in 30% for dependants brings the total to 10,000. |
| [7] | We have taken an approximate mid-point of the government's figures. |