Migration Watch UK
Immigration and the Labour Market
1 May, 2005
Summary1 The Government assert that the existence of 600,000 vacancies justifies the present very large scale immigration but:
| i) | The number of vacancies actually increased between August 2001 and 2004 despite net immigration of nearly half a million in that period. This confirms the view that, in an economy operating close to capacity, there will always be some labour shortages. Importing labour is self-defeating because it generates more demand leading to further "shortages" of labour - in effect, an open-ended demand for immigration. | |
| ii) | 600,000 is only just over 2% of the workforce. Some vacancies are to be expected in a dynamic economy and, indeed, are essential if people are to be able to change jobs. | |
| iii) | Only a quarter of these are vacancies due to a shortage of skilled workers. | |
| iv) | Migrant workers are nearly twice as likely to be unemployed as indigenous workers, suggesting that there is a mismatch between immigrants and vacancies. | |
| v) | Despite the high concentration of immigration in London, the proportion of skill shortage vacancies is very similar to that in the rest of England - indicating that immigration is helping to fill unskilled jobs, but having little effect on skills shortages. Indeed, higher skilled vacancies are more difficult to fill in London. | |
| vi) | An inflow of unskilled workers tends to depress wages, especially in London, and undermines Government efforts to encourage two million "economically inactive" people back to work. |
2 Employers are glad to recruit overseas as this avoids both higher wages and training costs. But overseas recruitment is a disincentive to training and re-training British workers. It is also a disincentive to labour saving investment. Furthermore, it is the tax payer who pays for the additional infrastructure required for the extra population.
3 Large scale immigration has a substantial impact on population growth, congestion and social cohesion. The alternative is to allow labour market mechanisms to operate so as to draw workers into skilled trades and to encourage higher productivity which is the only way to increase wealth per head.
4 The main argument for large scale immigration is that it reduces wage inflation and thus interest rates but this also points to unlimited immigration despite the extremely small benefit to the host population - approximately 25 per head per year.
Introduction
5 This paper examines the labour market arguments that have been advanced in support of the present large-scale immigration.
6 The value of skilled migration on a limited scale and in both directions is not in dispute. Migration of this kind is a natural consequence of an open economy. However, it is sometimes argued that skilled immigration is required on a substantial scale to fill shortages in various sectors. It is also suggested that unskilled labour is required to sustain businesses, especially those of a seasonal nature, that would otherwise have to close.
The present scale of immigration
7 At the outset it should be noted that net immigration is running at about 150,000 a year. In earlier years only about 20% of those who have subsequently settled originally came to the UK to work. The others were family members or asylum seekers. The rapid increase in the number of work permits from 42,000 in 1996 to 156,000 in 2004 together with a fall in asylum numbers in 2003-4 will alter these proportions. Even so, the number of legal immigrant workers is small in relation to a work force of some 27 million yet it has a significant effect over time on the population. According to the government's own projections, it will add five million to our population by 2031 - equivalent to five times the population of Birmingham. This, of course, will require heavy investment in infrastructure and will greatly increase congestion costs. None of these figures includes illegal immigrants whose numbers are unknown but are estimated by the government to run into hundreds of thousands.
The level of vacancies
8 The Government claim that there are 600,000 vacancies to be filled and that immigration is required to fill them. This represents about 2% of the total workforce. In other words, nearly 98% of jobs are already filled. There must be some vacancies available if people are to be able to switch jobs. The Chartered Institute of Personnel and Development annual survey (2004) indicates a turnover rate of 16%. Based on this measure over 4 million vacancies will arise each year due to staff turnover - so 600,000 is just 2 months turnover. The fact that vacancies are at this level does not, therefore, mean that we need 600,000 immigrants but it does indicate that the labour market is tight. This impression is reinforced by the recent figures (Table 1) for unemployment (on the ILO definition)1 of 1.41 million or 4.7%:
Table 1: UK unemployment rate
| 2001 | 2002 | 2003 | 2004 | |
| Thousand individuals | 1,412.9 | 1,519.4 | 1,414.0 | 1,387.0 |
| Rates (%) | 4.8 | 5.1 | 4.8 | 4.7 |
9 As this percentage is below the non accelerating inflation rate of unemployment (NAIRU), estimated in 2001 to be 5.5%, it is a further indication of a tight labour market. However, this is not a sufficient case for large scale immigration. The welfare of the existing community must also be considered. Martin Wolf2 put it like this:
"This point is ignored in some of the bad economic arguments made for immigration. Businesses, for example, protest that without immigration they would suffer chronic labour shortages. Yet, in an economy operating at close to full employment, some categories of worker will always be in excess demand. The market response is higher wages and more training. Understandably, business does not want to pay these costs. But some residents will, inevitably, be losers if they import labour instead.
Moreover, this is a self-defeating policy: if the response to "shortages" is to import labour, additional demand for goods and services and further shortages of labour will emerge. The argument from shortages creates an open-ended demand for more immigration: if the UK had a population of 120m it would still have job shortages and so a demand for yet more immigration. The demand could never be satisfied."
10 This point is illustrated by the development of vacancies, seasonally adjusted, over recent years. The graph below shows that vacancies actually increased between August 2001 and August 2004, despite net immigration of nearly half a million over that period.
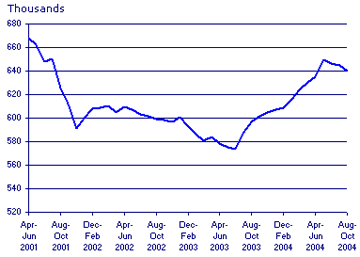
Job vacancies, three month averages (seasonally adjusted), UK
Source: Office for National Statistics
The economically inactive
11 The discussion so far has ignored the "economically inactive". According to the definitions adopted in the UK Labour Force Survey (LFS)3, individuals of working age can be employed, unemployed or inactive. Whether those who are not in employment are categorized as unemployed or economically inactive depends upon their job search activity and their availability for work. The unemployed are those who want to work, are available and are actively seeking a job - the inactive are those who are not in employment and are either not available for work or are not seeking it.
12 Table 2 sets out economic activity by age group, according to the International Labour Organisation (ILO) definitions. It shows (line 3) that there are nearly 900,000 inactive individuals aged 25 or more who express a desire to work.
13 The Table also shows (line 5) that in 2004 there were over 600 thousand sick or disabled who wished to work. These will be among the 2.7 million on incapacity benefit of whom, according to the Minister for Work (Jane Kennedy) speaking to the Social Market Foundation in December 2004, one third could return to work immediately. This was confirmed by Alan Milburn4 who said that one million people on incapacity benefit would like the opportunity to return to work provided the right level of support was available.
View table 2
14 In suggesting that the inactive can be considered as an important source of labour supply, we are following the approach of a government Green Paper5, which describes the need to move individuals from inactivity-related benefits into employment. Similarly, a recent study of inactivity rates across a selection of countries suggested that, "to such countries [with tight labour markets] the economically inactive represent a potential alternative source of labour supply"6. The Government Green Paper, Pathways to work: Helping people into employment (2002) emphasizes the potential of those on incapacity benefits.
15 International comparisons of the economically inactive also identify some unique problems faced by the UK in seeking to attract these individuals back into the labour market. Figures from the Eurostat 1999 Labour Force Survey (LFS) show that the UK has twice the EU average number of individuals registered as inactive due to sickness or disability7. Other research8 suggests that "there seems no question that some individuals who were hard to place in work were advised by the Employment Service to claim invalidity benefit" (the authors cite a report by the National Audit Office (NAO), 1989, to support their argument). The implication is that many individuals are registered as either long-term sick or disabled as a result of the perverse incentives of the benefit system.
16 Inactive individuals, who are often older and low skilled, are particularly hard to place in jobs. It would be wrong to assume that immigration does not have an impact on the labour market prospects of the inactive. A recent study9 estimates that immigration to the United States has led to unemployment among native high school dropouts and reduced their weekly earnings by around 8.9% during the period 1980 - 2000. (This figure was modified in 2004 to 7.4%).
17 The UK has the highest share of low-paid jobs (full-time workers receiving less than two-thirds of median gross earnings) in Europe - an incidence which has been pretty stable over the last two decades at 20 per cent10. This is likely to be a disincentive to labour participation among the inactive, especially if they are competing for jobs which are unskilled or semi-skilled in nature and may, therefore be caught in the "benefit trap". This seems to have been a particular problem in London since the late 1980s, and increasingly during the 1990s. Whilst the supply of jobs in the low-skill, low pay sub-market has risen, so has the supply of workers driven by international migration. "The result of the [labour] supply increase has been a downward pressure on wages and the maintenance of high levels of unemployment which is associated with the severe deprivation experienced within the capital"11.
18 One of Britain's top labour economists, Professor Richard Layard of LSE, who helped to design the Government's Welfare to Work programme expressed it in a letter to the Financial Times as follows:12
"There is a huge amount of evidence that any increase in the number of unskilled workers lowers unskilled wages and increases the unskilled unemployment rate. If we are concerned about fairness, we ought not to ignore these facts. Employers gain from unskilled immigration. But the unskilled do not."
19 Previous immigrants may be among the first to be affected. Recent analysis for the Home Office13 shows that persons born abroad have lower employment participation and higher unemployment than the UK born. Those born outside the EU / EFTA (European Free Trade Area) area had an unemployment rate of 9.5% compared to 5.5% for the UK born and a participation rate of 67.6% compared to 79.6%. Additionally, the Institute for Employment Research forecasts a fall in the proportion of low skilled jobs in London from 22% to 19% of jobs over the decade to 2010 (this implies a decline of 75,000 jobs), implying a situation where increasing proportions of low-skilled workers chase a smaller proportion of low-skilled jobs.
Seasonal labour supply
20 A Seasonal Agricultural Workers Scheme (SAWS) has been in force for many years. Throughout the 1990s, the quota was 10,000 a year. This rose to 15,200 in 2001 and 25,000 in 2003. The quota has since been cut to 16,250 to allow for the accession to the European Union of new East European members from where many SAWS workers were previously drawn. The Government's 5 year strategy for asylum and immigration14 issued in February 2005 stated that this scheme would now be phased out in consultation with employers.
21 In addition Sector Based Schemes were introduced in May 2003 in food processing and hospitality - each with a quota of 10,000. Both quotas were subsequently cut by 25% to allow for the accession of new countries to the European Union. These schemes will also be phased out.
How serious are the skills shortages?
22 In 1998 the Secretary of State for Education and Employment commissioned the National Skills Taskforce (STF) to advise on the development of a National Skills Agenda. It was envisaged that the STF would investigate possible current and future skill deficiencies and report on how these could be overcome. In its first report the STF15 emphasised the importance of retaining a clear distinction between firms' external recruitment difficulties (some of which might be considered as skill shortages) and their internal skills gaps. It also underlined the need for improving the information base, with a more extensive, and better coordinated, collection of labour market information.
23 As a result of these recommendations, the first Employer Skills Survey (ESS) was introduced in 1999 to meet the information needs of the STF; this targeted establishments with five or more employees. Table 3 is taken from the most recent (2003) version of the National Employer Skills Survey (NESS) and summarises the main findings16.
View table 3
24 At the time of the survey, 17% of the establishments reported that they had vacancies but only 4% attributed this to skills shortages (Skill Shortage Vacancies or SSVs). The table also shows that only 20 per cent of all vacancies (or 135,000) are hard-to-fill because of skills-related problems.
25 There is little apparent change in the pattern and extent of skills-shortages and vacancies since the first ESS in 1999. Indeed, more recent studies (from 2001 and 2003), record exactly the same proportion of establishments reporting hard-to-fill and skills shortage vacancies. Table 4 indicates that Associate Professionals and Skilled Trades are fields with a disproportionate number of skill shortage vacancies.
View Table 4
26 Table 5 suggests significant regional variability in the concentration of hard-to-fill vacancies. London's hard-to-fill vacancies make up only 0.7 per cent of employment in the capital, only just over half of the figure at a national level and in the immediately surrounding area. However, London's percentage of skill shortage vacancies is similar to that of the rest of the UK. Since 70% of international migrants come to London, this suggests that immigration is easing non skilled vacancies but not having much impact on skill shortages. This result is confirmed by the London Analytical Report, July 2003 (page 24).
View Table 5
Footnotes
| [1] | The International Labour Organisation (ILO) definition of unemployed is those without employment who want a job, have actively sought work in the previous four weeks and are available to start in the next two weeks (or have found a job and are waiting to start in the next two weeks). |
| [2] | Chief Economic Commentator, Financial Times, on 27 January 2005. |
| [3] | Which adopts the measurement norms of the International Labour Organization (ILO). |
| [4] | Today Programme 15 January, 2005. |
| [5] | Department for Education and Employment (2001), ‘Towards full employment in a modern society’, March. |
| [6] | Weir, G. (2003), “Economic Inactivity in Selected Countries”, Labour Market Trends, June. |
| [7] | Webster 2001. |
| [8] | Nickell and Quintini (2001). |
| [9] | Borjas 2001. |
| [10] | OECD Employment Outlook, 2003. |
| [11] | The London Labour Market, GLA Economics. |
[12] |
Financial Times 20 May, 2002. |
| [13] | Dobson et al 2001 |
| [14] | 14 CM 6472 |
| [15] | National Skills Task Force (1998), Towards a National Skill Agenda, Department for Education and Employment. |
| [16] | The data are weighted and therefore figures reflect the situation in the UK as a whole, not just in the sample under analysis. |