The Outlook for EU Migration
Updated 23 June, 2014
Summary
1. Large scale net migration is a new phenomenon, having begun in 1998. Between 1998 and 2010 around two thirds of net migration came from outside the EU. Government policy is now achieving substantial reductions in non-EU net migration. British emigration is fairly stable. However, efforts to reduce total net migration risk being undermined by continued and large scale immigration from the EU resulting from its recent eastwards expansion and the economic crisis in Southern Europe. Indeed, net migration from the EU could well remain at about 130,000 a year for the medium term.
2. Clearly EU migration must now be substantially reduced if the overall inflow is to be brought down to an acceptable level. One possible option would be to seek to deny access to in-work benefits and tax credits to all migrants for the first five years. This would remove part of the economic incentive and might somewhat reduce East European migration but it would certainly involve a difficult negotiation with EU partners and the Commission.
3. The only way to limit EU migration for work would be to impose a requirement for work permits (sometimes described as a “green card” system) but this would run entirely counter to the fundamental principle of free movement and would undermine the single market. It would almost certainly be impossible to negotiate. If, therefore, migration from Romania and Bulgaria turns out to be substantial and migration from the rest of Eastern Europe continues at present levels there is likely to be tension between continued membership of the EU and our ability to control our own borders with significant effects on the size of our population.
The Nature of EU Migration
4. EU migration to and from the UK is mainly for work reasons. In the last ten years around two thirds of EU immigrants coming to the UK stated that their main reason for doing so was to work[1]. Also a portion of the remaining immigrants will be accompanying those coming for work. Similarly around half of those EU migrants who left the UK to return home (or go elsewhere) gave work as the main reason for leaving[2].
5. Overall, immigration from the EU is likely to be rather more temporary in nature than immigration from the rest of the world. In the last ten years EU migrants are estimated to have left the UK at half the rate that they arrived. In comparison, non-EU migrants have departed the country at a third (36%) of the rate that they arrived. However, this masks differences between the EU15 of Western Europe and the poorer EU8 from the East. For the EU15 the rate of outflows was 65% of inflows, while for the poorer EU8 the rate of outflows was lower at an estimated 40% - close to the figure for non-EU migration.
The Scale of EU Migration
a) EU15 Migration[3]
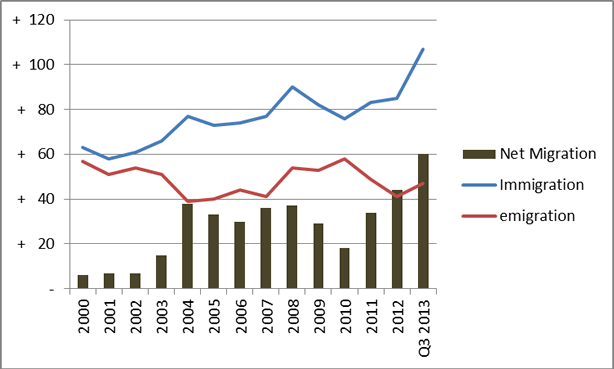
6. Net migration from the EU15 was steady at around 35,000 between 2004 and 2008. It fell in 2009 and 2010 when the UK economy entered recession but numbers have since increased. In the last year immigration has jumped significantly resulting in net migration of 60,000. This is shown in figure 1 below.
Figure 1. EU15 immigration, emigration and net migration, 2000 to September 2013
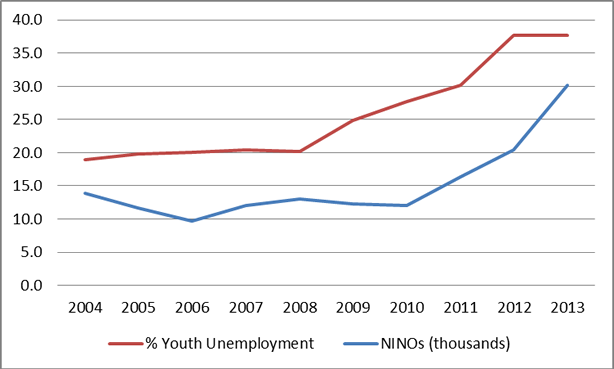
7. Many of the new immigrants are from southern Europe. Figures 2-4 below show the strong correlation between the rise in youth unemployment in Spain, Italy and Portugal and the increase in National Insurance Numbers issued in the UK to migrants from those countries.[4]
Figure 2. Spain - Youth unemployment and National Insurance numbers issued
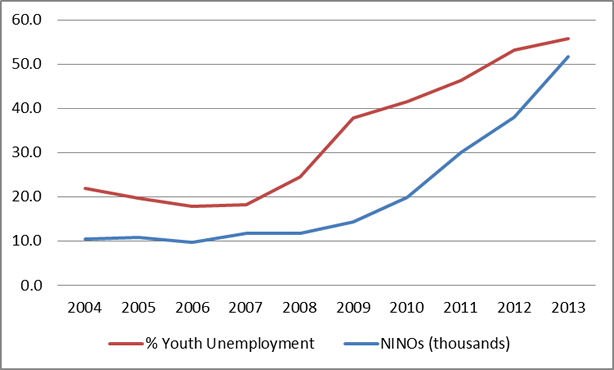
Figure 3. Italy - Youth unemployment and National Insurance numbers issued
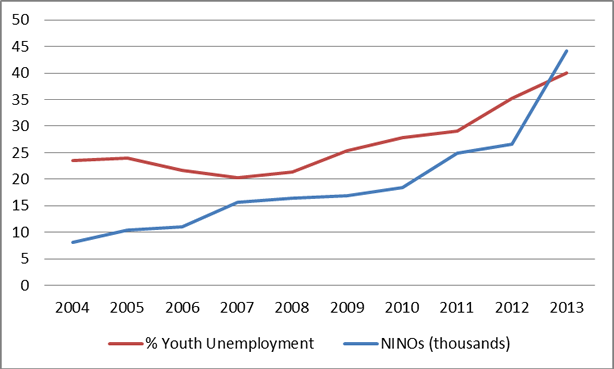
Figure 4. Portugal - Youth Unemployment and national Insurance numbers issued
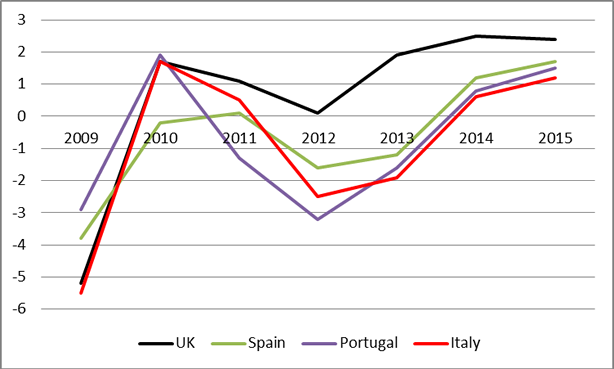
8. Unlike the UK, the Eurozone countries of Spain, Italy and Portugal have experienced negative GDP growth in the last two to three years. Economic forecasts expect this to change this year and next with a return to economic growth. This is shown in Figure 5 below.
Figure 5. Annual Change in GDP Growth – Actual and Expected, 2009-2015[5][6]
9. Despite a return to economic growth there is only expected to be a marginal impact on unemployment rates in the three countries in the next few years. Therefore, the current incentive to migrate to the UK to look for work will largely remain and the growing diaspora of immigrants from these countries living in the UK will draw in more migrants. Many of these new immigrants may return home at some point (see paragraph 5) perhaps after only a few years in the UK (between 2000 and 2010 three-quarters of EU migrants who did leave the UK had stayed for four years or less[7]). However, given economic conditions in their home countries, it is hard to see net migration from the EU15 falling back below an average of 40,000 within the medium term.
b) EU8 Migration[8]
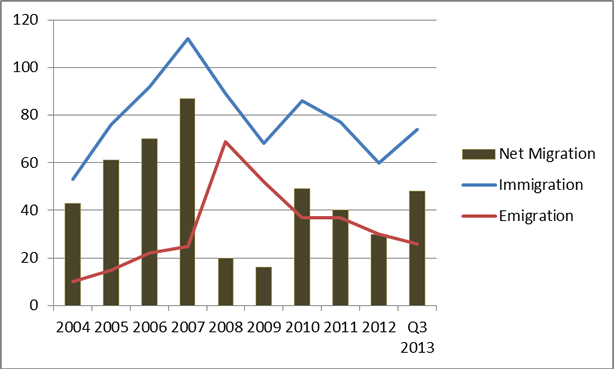
10. Following enlargement of the EU in 2004 there was a large flow of immigrants from Eastern Europe. There is a strong financial incentive to come and work in the UK where the minimum wage can be several times higher than even the average income back home[9]. Net migration fell in 2008 and 2009 as some of those migrants returned home when the economic crisis hit and they lost their jobs[10]. However, since 2010 net migration has averaged 42,000 with an increase in 2013 to 48,000 due to both a rise in immigration and a fall in emigration. This is shown in figure 6 below.
Figure 6. EU8 immigration, emigration and net migration, 2004 to September 2013
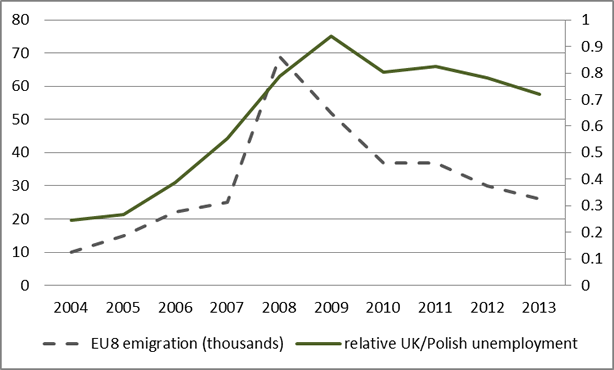
11. Home Office research found a strong correlation between the rate of emigration and the relative unemployment rates in the UK and the EU8[11]. The lower the relative rate of unemployment in the UK, the lower the rate of emigration back to the EU8. This is illustrated in figure 7 below. One of the motives for migration from the EU8, especially initially, was to save up money in the UK which could be used back home and the Home Office Research also highlighted the possible effect of the exchange rate between the Pound and Polish Zloty on the rate of emigration. In 2008 the rapid rise in emigration also corresponded to a dramatic decrease in the value of the Pound against the Zloty from 5.5 in 2007 to 4.4 in 2008.
Figure 7. Relative UK/EU8 unemployment and emigration
12. An added complication when trying to estimate the future level of migration from the EU8 is the inaccuracy of the historical net migration statistics. The 2011 Census for England and Wales has now revealed that the International Passenger Survey underestimated EU8 migration by around 450,000 in the period between 2004 and 2010. This error in the IPS also suggests that net foreign migration between 1997 and 2010 was in fact closer to 4 million.
13. Given the growing UK economy and the ongoing strong financial incentive to move to the UK from the EU8 it is, despite the uncertainties, reasonable to anticipate continuing positive net migration of at least 40,000 a year, bearing in mind also the increases in the EU8 population in the UK that we have seen in recent years.
c) Romania and Bulgaria
14. For the year ending September 2013 the net migration estimate from Romania and Bulgaria (the A2) was 21,000[12]. From 1 January 2014 the transitional controls on the employment of these citizens ended and they gained full access to the labour market. This is likely to lead to a steady increase in migration and our central estimate is that 50,000 Romanian and Bulgarian migrants will migrate to the UK in each of the first five years[13]. This figure is based on the growth in the population in the UK from these two countries as it is not certain how much of this migration will be captured in the net migration estimates from the International Passenger Survey.
Total EU Net migration
15. Taking these elements together, EU net migration could run at perhaps 130,000 a year in the medium term as set out below.
Table 1. Estimate of net migration from the EU in Medium Term.
| Region | Net Migration estimate |
| EU15 | 40,000 |
| EU8 | 40,000 |
| A2 | 50,000 |
| TOTAL | 130,000 |
Non-EU net migration
16. Non-EU net migration has fallen to around 140,000 a year from 217,000 in 2010. As government policies continue to take effect, we expect non-EU net migration to carry on falling. However, a significant further fall would require a much greater level of compliance than is currently the case, notably the departure of students at the end of their courses.
Overall Net Migration
17. If non-EU net migration does fall to about 100,000 per year and EU migration stays at around 130,000 it would become, for the first time, the main source of net migration. Taking into account net British emigration which has averaged around 70,000 a year in the last fifteen years this would also mean that net migration would be in the order of 160,000 a year.
Reducing Net Migration from the EU
18. Reducing net migration from the EU is therefore essential. For so long as the UK remains in the EU there can be no interference with the principle of free movement from every other Member State. Policy can therefore only address the incentives to migrate to the UK. Most EU migrants come to the UK to work but in-work benefits, such as tax credits, add to the incentive of higher pay than is available back home, or even if no job is available, to subsidise declared self-employment.
19. Migrants from the EU have one of the highest employment rates of all groups in the UK, with 79% of EU8 born workers in employment, compared to 71% of the UK population more widely. However, this should not be used as an indication of the extent to which they are actually able to maintain themselves and their families in the UK. EU8 migrants have on average lower wages, many are employed at no more than minimum wage, and many declare themselves self-employed with little evidence of income at even minimum wage levels.[14] At this level, both employees and self-employed are heavily subsidised by the taxpayer through in-work benefits and tax credits. For example a single worker on the minimum wage in the UK would be able to earn four and a half times that which they could earn in Romania. This includes working tax credit and housing benefit which make up 28% of the final take home pay. For a family the gains of employment in the UK are even more significant. A worker with a dependant spouse and two children working at the minimum wage in the UK earns almost nine times what could be earned in Romania, taking home £28,241 per year, 66% of which is made up of tax credits and benefits paid for by the UK taxpayer.
20. If in-work benefits and tax credits were to be withheld until the individual had contributed taxes for a period of time (five years for example, as applies to non-EU migrants) the incentive to migrate would be less strong but still significant. Single workers from the EU8 would only be able to increase their wage by three times by moving to the UK. The family would only increase their wage by two and a half times. The effect of benefits is set out in a Table in Annex A.
21. The wage differential is less for southern European EU15 countries, but these have high unemployment and often greater restrictions around access to welfare than migrants from those countries would face in the UK.
Recommendations
22. The status quo is unacceptable to the public who are deeply opposed to continued mass immigration and have given the government a clear mandate to reduce net migration to tens of thousands. There is a policy solution available to the government that would address the tension between immigration control and continued membership of the European Union.
23. The government, as part of its renegotiation with the EU could require that access to benefits for EU citizens be denied for five years, as is the case with most non-EU migrants. This would ensure that only those who had contributed to the system would be able to avail themselves of its safety net. It would not interfere with the free movement of workers able to maintain themselves and pay their way, still less the movement of visitors and tourists. It would ensure that the UK remains a destination for highly qualified individuals such as French bankers and German engineers who would be entirely unaffected, yet it would prevent workers from the poorest EU countries migrating to the UK in order to substantially increase their incomes at the expense of subsidy by UK taxpayers. It would thus correct the decision to open up the welfare systems of the richer 15 members to 100 million people from new member states with a GDP per head of about one quarter of that of many of the existing members.
Conclusion
24. As non-EU migration falls, EU migration will become the central issue. EU net migration running, as recorded, at say 130,000 will result in an unacceptably high level of net migration. Delaying access to the full UK welfare system could reduce some of the flow. However, there is still likely to be significant tension between continued membership of the EU and effective immigration control.
30 March 2014
Annex A
Table 2. Total Household Income at Minimum Wage in the UK, with and without Benefits.
Total Household Income at Minimum Wage |
|||
GBP |
With Benefits |
Without Benefits |
|
Single Person |
Couple and Two Children |
Single Person/Couple and Two Children |
|
Gross Earnings |
213 |
213 |
213 |
Income Tax |
18 |
18 |
18 |
National Insurance |
11 |
11 |
11 |
Net weekly income |
184 |
184 |
184 |
|
|
|
|
Working Tax Credit |
17 |
53 |
0 |
Child Tax Credit |
0 |
99 |
0 |
Child Benefit |
0 |
34 |
0 |
Total direct benefits |
17 |
186 |
0 |
|
|
|
|
Housing Benefit |
53 |
161 |
0 |
Council Tax Benefit |
0 |
12 |
0 |
Total Housing Benefits |
53 |
174 |
0 |
|
|
|
|
Total Income per week |
254 |
543 |
184 |
Total Annual Income |
13218 |
28241 |
9568 |
Footnotes
- International Passenger Survey estimates of long term international migration, table 3
- ibid
- EU 15 consists of Austria, Belgium, Denmark, Finland, France, Germany, Greece, Ireland, Italy, Luxembourg, Netherlands, Portugal, Spain, Sweden, (figures excludes UK nationals).
- Correlation between 0.83 and 0.9, standardised values.
- 2009-2012 data taken from the World Bank URL: http://data.worldbank.org/indicator/NY.GDP.MKTP.KD.ZG/countries/GB?display=default
- 2013 and forecast data for 2014 and 2015 taken from the European Economic Forecast, Winter 2014, European Commission URL: http://ec.europa.eu/economy_finance/publications/european_economy/2014/pdf/ee2_en.pdf
- Show -6 more...
- International Passenger Survey estimates of long term international migration, table 3
- ibid
- EU 15 consists of Austria, Belgium, Denmark, Finland, France, Germany, Greece, Ireland, Italy, Luxembourg, Netherlands, Portugal, Spain, Sweden, (figures excludes UK nationals).
- Correlation between 0.83 and 0.9, standardised values.
- 2009-2012 data taken from the World Bank URL: http://data.worldbank.org/indicator/NY.GDP.MKTP.KD.ZG/countries/GB?display=default
- 2013 and forecast data for 2014 and 2015 taken from the European Economic Forecast, Winter 2014, European Commission URL: http://ec.europa.eu/economy_finance/publications/european_economy/2014/pdf/ee2_en.pdf
- Emigration from the UK, Home Office Research Report 68, November 2012 URL: https://www.gov.uk/government/publications/emigration-from-the-uk
- EU8 consists of Czech Republic, Estonia, Hungry, Latvia, Lithuania, Poland, Slovakia, Slovenia
- URL: http://www.migrationwatchuk.co.uk/briefing-paper/4.15
- Emigration from the UK, Home Office Research Report 68, November 2012 URL: https://www.gov.uk/government/publications/emigration-from-the-uk
- ibid
- International Passenger Survey estimates of long term international migration, table 3
- URL: http://www.migrationwatchuk.co.uk/briefing-paper/4.17
- Migration Watch UK, ‘An Assessment of the Fiscal Effects of Immigration to the UK’, March 2014, URL: http://www.migrationwatchuk.co.uk/pdfs/BP1_37.pdf, Tax Research UK, ‘Disappearing Fast: The falling income of the UK’s self-employed people’, November 2013, URL: http://www.taxresearch.org.uk/Documents/SEI2013.pdf