Many East Europeans Work Hard But How Many Pay Tax?
30 April, 2014
Summary
1. A single worker on the minimum wage pays in barely a pound a week in tax. If he or she has a dependent partner they are likely instead to take nearly £90 a week from the taxpayer; if they have two children this increases to nearly £300 a week. There are also major costs in later life, for pensions and health, to which the low-paid will make no significant contribution. It follows that attempts to justify low-paid immigration on the basis of taxes paid must fail because they ignore not only the tax credit system but also future commitments.
Introduction
2. It is often claimed that “immigrants work hard and pay taxes”. We know from the Labour Force Survey that some groups of migrants have a high employment rate. For example the average employment rate in the UK is 71.3%, with UK born people having an employment rate of 72% and the non-UK born a rate of 70%. Within that, migrants from the A8 countries have a higher rate of employment at almost 80%. However, some other migrants have a very low employment rate: the rate of employment amongst those born in Pakistan and Bangladesh is 50%. The reasons behind this are beyond the scope of this paper. Migrants also work at widely different rates of pay, for example the average hourly rate of an Australian born male in the UK in 2012 was £18.98, slightly higher than that of £17.79 for a UK-born male, while in contrast the rate for a male from the EU A8 was only £9.34.[1] So while it is certainly true that many migrants work hard, it is also the case that many are working at or close to the minimum wage.
3. People who work at the minimum wage pay virtually no net tax and, if in a couple, rather than paying tax they can receive significant sums in tax credits and other benefits. Therefore, while many migrants work hard, they do not all contribute in direct taxation to the Exchequer as is often suggested. This paper excludes indirect taxes paid such as VAT but it also excludes other costs such as healthcare and education. This paper, therefore, is an analysis of direct taxes paid to and benefits received from the Exchequer.
Tax Paid and Benefits Received
4. The system of benefits has developed over time to protect workers from loss of earnings and to support the low paid. Tax credits were introduced to raise the take-home pay of poorer families and lift children out of poverty.
5. The effect of benefits and tax credits is that a single worker on the minimum wage pays just over £1 more in tax than he or she receives back in benefits and tax credits. A single-earner couple receives nearly £90 per week more in benefits than they pay in tax. If there are two children this becomes £295.
Table 1. Net Income per week, outlining tax paid and benefits received, in three cases.
| £’s | Single Person | Sole Earner Couple | Sole Earner Couple with Two Children |
| Wage | |||
| Per hour | £6.31 | £6.31 | £6.31 |
| Per week | £220.85 | £220.85 | £220.85 |
| Net Tax Paid | |||
| Income Tax Paid | £5.71 | £5.71 | £5.71 |
| MinusTax Credits Received | -£12.76 | -£51.03 | -£167.28 |
| Net Income Tax Paid / Received | -£7.05 | -£45.32 | -£161.57 |
| Plus: National Insurance paid | £8.14 | £8.14 | £8.14 |
| Excess of Income Tax and N.I. Paid Minus Tax Credits Received | £1.09 | -£37.18 | -£153.43 |
| Social Benefits Received | |||
| Child Benefit | - | - | -£34.05 |
| Housing Benefit | - | -£50.51 | -£102.16 |
| Council Tax Benefit | - | - | -£5.33 |
| Total of Net Taxes Paid minus Social Benefits Received | £1.09 | -£87.69 | £294.97 |
6. Families with more than two children receive higher levels of these cash benefits. The extra amounts received, over and above taxes paid in, typically amount to over £400, nearly £500, and over £600 per week for a sole earner couple with three, four, and five children.
Two Earner Couples
7. Two earner couples without children on the minimum wage are not a burden on the taxpayer in terms of direct taxes. A couple who both earn the minimum wage pay about £28 more a week in tax than they receive in tax credits and benefits.
8. However, a two earner family with two children who will require childcare while they are both working receives nearly £400 more in tax credits and benefits than they pay in taxes, as shown in Table 2.
Table 2
| Two Earner Couple | Two Earner Couple and Two Children | |
| Wage | ||
| Per hour | £6.31 | £6.31 |
| Family earnings, both working 35 hour week | £442 | £442 |
| Net Tax Paid | ||
| Income Tax Paid | £11.42 | £11.42 |
| Minus: Tax Credits Received | - | £286.73 (including Childcare Tax Credit) |
| Net Income Tax Paid/ Received | £11.42 | -£275.32 |
| Plus: National Insurance | £16.28 | £16.28 |
| Excess of Income Tax and N.I. Paid Minus Tax Credits Received | £27.70 | -£259.03 |
| Social Benefits Received | ||
| Child Benefit | - | -£34.05 |
| Housing Benefit | - | -£84.97 |
| Council Tax Support | - | -£0.04 |
| Total of Net Taxes Paid minus Social Benefits Received | £27.70 | -£378.09 |
Breaking even
9. The point at which migrants earn enough to be no burden on the state depends on family circumstances. The Migration Advisory Committee carried out a comprehensive analysis in 2011. This paper calculates on a similar basis how much typical families have to be earning before they start making any contribution to the Treasury, taking account of current 2014/15 rates, as outlined in table 3.
Table 3.
| Family | Dependents | Gross weekly earnings required (nearest £) |
| Single person | No children | £220 |
| One child | £439 | |
| Couple with one earner | One child | £458 |
| Two children | £541 | |
| Three children | £656 | |
| Couple with two earners | Two children | £860* |
* assuming childcare claimed only for two-earner families.
Focus on Eastern Europe
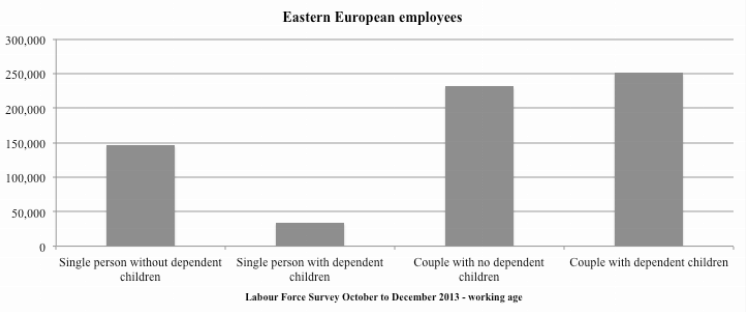
10. Figure 1 illustrates the extent to which migrants from Eastern Europe with jobs as employees in the UK are likely to fall into different family types. The relative proportions are close to those of the underlying UK population, but those of single people without dependent children and of couples with dependent children are somewhat higher.
Figure 1.
11. If one looks at actual gross weekly earnings for migrants from the Eastern European countries of the EU who are employed in the UK, it is clear that a significant number are unlikely to be making any net contribution to the Treasury, since half of them are earning no more than £300 a week.
Figure 2.
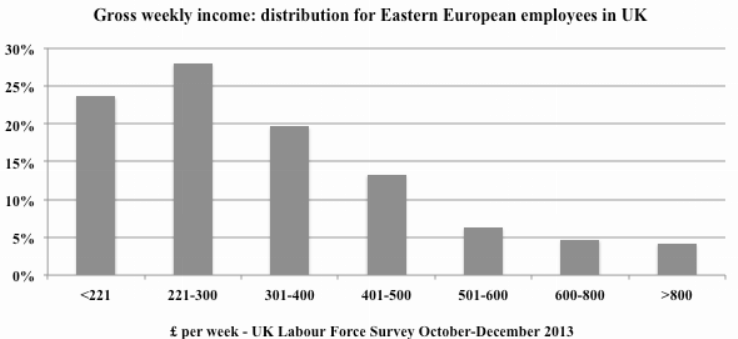
12. Figure 2 represents the earnings distribution of 650,000 Eastern European employees. Nearly one quarter of them are earning the minimum wage or less. Indeed the data show that that nearly one in six of these Eastern European workers earns less than half the equivalent of the minimum wage for a full week (i.e. gross weekly earnings below £111), and it is notable in this context that even single earners with no children earning the minimum wage for a full week’s work pay into the Exchequer only just more than they get (see table 1 above). It is also noteworthy that only 4.5% fall in the higher tax bracket compared with around 15% for the UK population as a whole.
Future Commitments
13. The costs outlined above are a snap shot of the difference between direct tax payments and cash benefits received by active people of working age and working. There are also major costs in later life to which the low-paid will make no significant contribution;
- Pensions
The new flat-rate pension is worth £144 a week (in 2013 money). A pensioner can expect to have an average of at least 10 years in retirement which, at £144 a week gives a total cost of £75,000. - Health
Health Service costs also increase sharply in retirement. Government figures show that these are £80 a week for a single pensioner or £160 for a couple. For a ten year period of retirement, the total cost would be £42,000 for a single pensioner or £84,000 for a couple.
14. It follows that attempts to justify low-paid immigration on the basis of taxes paid must fail because they ignore not only the tax credit system but also future commitments. The combined costs of pensions and later health costs alone amount to nearly £120,000 for a single pensioner and £160,000 for a couple. The taxes paid by low-paid immigrants will be insufficient to pay any of these amounts so the whole cost will fall on the resident population.
15. That said, all migrants are different. Some will come for a short period of time on a work visa and will consume very little in public services. For example, the burden of single workers on a five year Tier 2 Visa (assuming that they do not go on to get settlement) is very small as they are more likely to be young and healthy placing little strain on the health services. They will already have been educated in their home country and will not draw a state pension. However, some will settle and may move up the income scale but they may also have children, placing burdens on the health and education systems etc.
Conclusion
16. Many migrants might work hard but, when they work at or close to the minimum wage, as is the case for nearly half of those from Eastern Europe, they pay very little in tax and many will make no contribution at all. Research claiming that recent EEA migrants contribute far more than they receive critically failed to take any account of income levels in estimating the cost of the means-tested benefits. In fact, as this paper shows, those with families may receive far more from the taxpayer in cash benefits than they pay in tax and National Insurance.
Footnotes
- See The Migration Observatory, ‘Characteristics and Outcomes of Migrants in the UK Labour Market’, October 2013, URL: http://www.migrationobservatory.ox.ac.uk/briefings/characteristics-and-outcomes-migrants-uk-labour-market
- See The Migration Observatory, ‘Characteristics and Outcomes of Migrants in the UK Labour Market’, October 2013, URL: http://www.migrationobservatory.ox.ac.uk/briefings/characteristics-and-outcomes-migrants-uk-labour-market