Youth Unemployment and Immigration from the A8 Countries
6 January, 2012
Summary
1 The accession of eight former Soviet-bloc countries in Eastern Europe – the A8 - to the European Union from May 2004, led to a very substantial migration from these countries to the UK. Around 1.6 million workers from the A8 have come to the UK since accession.[1] Many will have returned but the number of people from these countries working in the UK increased by 600,000[2] between the second quarter of 2004 and the third quarter of 2011. The impact on the UK labour market has clearly been significant. For example, in 2006-07 alone almost 223,000 Polish migrants registered in the UK to work[3]. Estimating the impact of this migration on employment levels of UK-born workers has proved to be very challenging, and the methodologies of those few studies that have looked into it have been criticised. Studies have had greater success with gauging the impact of migration into the UK on wage levels, which – for the lowest 15 per cent of earners – have been adversely impacted. According to the NIESR, the impact of East European migration on our GDP per capita can be expected to be negligible.
Youth Unemployment in the UK and A8 Migration
2 A particular challenge is estimating the impact of this migration on levels of youth unemployment in the UK. During the transition period since their accession in May 2004, an estimated 1.6 million workers came to the UK from the new EU Member States. Between the first quarter of 2004 and the third quarter of 2011, employment of workers born in the A8 increased by 600,000. Over the same period the number of unemployed young people in the UK almost doubled, from 575,000 to just over a million. Figure 1 plots the two variables. Is there a causal linkage between the two?
Figure 1: Youth Unemployment and A8 Migration
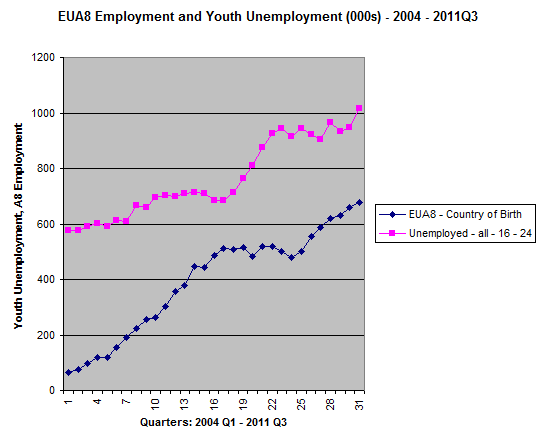
Source: ONS
3 The major cause of higher unemployment among the young must be the economic recession. However, examination of the characteristics of A8 migrants would suggest that their arrival might well have been a factor because of the high ‘employability’ of immigrants from these countries and their age profile. A8 migrants to the UK are:
- disproportionately young compared to the UK population as a whole: in 2008 about 70 per cent of A8 migrants were aged between 18 and 35, compared to about a third of all immigrants and less than a quarter of UK born.
- relatively highly educated: whilst the median school-leaving age for UK-born workers was 16 in 2008, for A8 migrants to the UK it was 19 years of age
- strongly motivated to work – in most cases, seeking employment is the primary motivation for immigration, and their participation rate in the economy is higher than for UK-born. For men from the A8 the participation rate is 95 per cent and for women, 80 per cent. Comparable figures for the UK born are 83 and 75 per cent respectively[4]. A8 workers have frequently been praised for their strong work ethic
- prepared to work for low wages: 89% of A8 (and Romanian and Bulgarian) workers earned less than £400 a week in 2007, compared to 57 % of UK-born workers
Empirical Studies and Their Limitations
4 There have been a few econometric studies which have looked at the labour market impacts of A8 migration into the UK, but no published studies which have looked specifically at impacts on the unemployment of young UK-born workers. The studies have found no “statistically significant” linkage between A8 immigration and the employment of UK workers.
5 These results have been criticised on the grounds that they are counter-intuitive, given the scale of A8 migration into the UK and the characteristics of the migrants. Furthermore, estimation of labour market impacts is beset by technical problems of errors in measuring data, and uncertainty about the overall impact of migration on labour markets. These concerns were expressed by Professor Rowthorn, Emeritus Professor of Economics at Cambridge University, in evidence to the House of Lords Economic Affairs Committee Inquiry (in 2007/08) into the economic impact of immigration into the UK. He argued that finding effects that are statistically insignificant “does not mean that they are small, it simply means that there is too much noise in the system to estimate them accurately”. Below is an extract from Professor Rowthorn’s written submission to this inquiry:
House of Lords – Select Committee on Economic Affairs – The Economic Impact of Immigration - Volume 11 – Evidence:
Impact on the Labour Market
“An indication of the potential scale of this competition in the UK is given by the statistics on the operation of Eastern European migrants who are registered under the worker registration scheme. Between May 2004 and March 2007, the number of national insurance certificates granted to such migrants was 623,575 and 77% earned between £4.50 and £5.99 per hour. Over this period, the statutory minimum wage was in the range £4.50 to £5.35 per hour for adults. It is hard to believe that competition on this scale has no effect on the economic prospects of local workers, as many advocates of immigration claim. Indeed, such a claim is inconsistent with the widely accepted argument that modern technology and structural change in the economy have destroyed many low-skill jobs and undermined the labour market position of low-skilled workers. If workers at the bottom end of the skill ladder are losing out because of adverse shifts in the demand for unskilled labour, then it seems obvious that their situation can only be made worse by making them compete with migrant labour. Those who point this out are often accused of a racial preference in favour of white locals against non-white immigrants. In the case of the UK, many of the locals who compete with low-skilled migrants are from ethnic minorities, for example black Caribbeans, whereas nowadays the immigrants are often white. This situation is similar in the United States, where unskilled black workers face competition from Hispanic migrants
Estimation
“The following are some of the main difficulties:
Causality. Immigrants tend to go to areas where there is a strong demand for labour. These are likely to be areas where employment for local workers is high or rising. This could be interpreted incorrectly as evidence that immigration into an area creates employment for locals.
Induced Migration. When immigrants come into an area, this may cause locals to leave or may deter people from moving into the area from elsewhere. The result will be a ripple effect, whereby a migration “shock” in one area is dissipated to the rest of the country. For example, if there is a big inflow of migrants into London, there may be initially a rise in local unemployment. After a time, some residents of London may go to Scotland and fewer Scots may come to London. As a result, unemployment may eventually increase in Scotland and fall back again in London. This means that the conventional “spatial correlation” method for analysing the effects of immigration may seriously underestimate its impact. Hatton and Tani have shown that induced migration in the UK is important and they warn that it may result in a downward bias in the estimated impact of migration on the labour market.
Measurement Error. Migration statistics are based on samples and are subject to error. The econometric analysis of migration normally subdivides the population into “cells” based on such factors as area, education, age or gender. Many of these the cells have a very small number of migrants in them and the resulting errors may be proportionately very large. …this may lead to a serious underestimate of the impact of migration on the labour market. A similar point about the bias arising from errors was made by Rowthorn and Glyn. All of the above factors lead to a downward bias in the estimated impact of migration on the labour market. Econometricians normally seek to correct for this bias but it is often very difficult”.
6 It is worth noting that Studies have had greater success with gauging the impact of migration into the UK on wage levels, which – for the lowest 15 per cent of earners – have been adversely impacted[6].
7 As regards Eastern European migration, a study by the National Institute for Economic and Social Research (NIESR) in April 2011 found that “the long run impact on [UK] GDP per capita can be expected to be negligible”[7]
Conclusion
8 Youth unemployment in the UK increased by almost 450,000 in the period from 2004 Q1 to 2011 Q3, from 575,000 to 1,016,000. Over the same period, numbers of workers from the A8 countries grew by 600,000. Correlation is not, of course, proof of causation but, given the positive employability characteristics and relative youth of migrants from these countries, it is implausible and counter-intuitive to conclude – as the previous Government and some economists have done - that A8 migration has had virtually no impact on UK youth unemployment in this period. Accurate estimation of the size of the impact is beset with problems of statistical ‘noise’ and more research needs to be done to assess the true scale of the impact.
Sources of Data
EHRC -The UK’s New Europeans – Progress and Challenges Five Years after Accession
www.equalityhumanrights.com
Dustmann, C and Frattini, T and Halls, C. July 2009. Assessing the Fiscal Costs and Benefits of A8 Migration to the UK. CReAM Discussion Paper 18/09
http://www.cream-migration.org/publ_uploads/CDP_18_09.pdf
House of Lords – Economic Affairs Committee: The Economic Impact of Immigration – Vol 11 Evidence
http://www.publications.parliament.uk/pa/ld200708/ldselect/ldeconaf/82/82ii.pdf
Migration Advisory Committee – Limits on Migration (November 2010)
http://www.ukba.homeoffice.gov.uk/sitecontent/.../mac-limits-t1-t2/report.pdf?view=Binary
Footnotes
- Hansard 26 April 2011 Column 84 gives 1.1 million as the total of registrations under the Worker Registration Scheme. http://www.publications.parliament.uk/pa/.../110426-0002.htm
Following the methodology of Pollard et al. (2008), we take the total number of approved WRS applications, and multiply it by 1.49 to account for an estimated 33 per cent of A8 workers who do not register with the scheme. - http://www.ons.gov.uk/ons/rel/.../index-of-data-tables.html#tab-Employment-tables Table EMP 05
- http://www.equalityhumanrights.com/uploaded_files/new_europeans.pdf page 14
- Dustmann et. Al – see Sources of Data
- House of Lords Report The Economic Impact of Immigration paragraph 83 - http://www.publications.parliament.uk/pa/.../82/8202.htm
- Migration Advisory Committee – Limits on Migration: http://www.ukba.homeoffice.gov.uk/sitecontent/.../report.pdf?view=Binary
- Show -6 more...
- Hansard 26 April 2011 Column 84 gives 1.1 million as the total of registrations under the Worker Registration Scheme. http://www.publications.parliament.uk/pa/.../110426-0002.htm
Following the methodology of Pollard et al. (2008), we take the total number of approved WRS applications, and multiply it by 1.49 to account for an estimated 33 per cent of A8 workers who do not register with the scheme. - http://www.ons.gov.uk/ons/rel/.../index-of-data-tables.html#tab-Employment-tables Table EMP 05
- http://www.equalityhumanrights.com/uploaded_files/new_europeans.pdf page 14
- Dustmann et. Al – see Sources of Data
- House of Lords Report The Economic Impact of Immigration paragraph 83 - http://www.publications.parliament.uk/pa/.../82/8202.htm
- Migration Advisory Committee – Limits on Migration: http://www.ukba.homeoffice.gov.uk/sitecontent/.../report.pdf?view=Binary
- http://www.niesr.ac.uk/pdf/270411_143310.pdf page 2