Social Housing and Migration in England
15 August, 2011
Key Findings
- Non EU migrants are 30 per cent more likely to live in social housing than the UK born.
- The period of high net migration from 2002 coincided with an increase of over 60 per cent in the waiting list for social housing.
- Over the past decade the number of social houses has fallen by over half a million.
- To provide social housing for migrant households we are likely to need around 415,000 additional social homes over the next 25 years – equivalent to over 16,000 a year or 45 additional homes every day.
- Based on current data, the cost to the taxpayer of providing these additional social homes will be around £25 billion, or one billion pounds a year.
Demand for Housing
1. Net migration leads to an increase in demand for housing, reflected in projected household formation.
2. The three main types of housing provided in the UK are: owner occupier, private rented accommodation, and social housing, provided by local authorities or other ‘social landlords’. The ability of migrants to access these different types of housing is dependent on a range of factors, including household incomes, wealth, ability to borrow through credit markets, length of stay in the UK, rents, house prices and legal entitlement to social housing.
3. Migration leads to an increase in demand for social housing, driven either by members of the resident population being priced out of the private sector by increased demand from migrants, or by migrants becoming directly eligible for social housing tenancies after a number of years of residence. Foreign nationals now occupy 8.4% of the social housing stock. Among occupants aged 16-40 that figure rises to 12.6%.[1]
4. Table 1 below, taken from the Migration Advisory Committee’s report ‘Limits on Migration’[2] (see Data Sources) shows that newly arrived migrants overwhelmingly live in privately rented accommodation. This changes for migrants domiciled in the UK for five years or longer, amongst whom a majority are owner occupiers.
Table 1: Housing Tenure by Country of Birth and Number of Years Since Last Arrival in the UK - %
| Tenure | UK Born | EEA Born – less than 5 years | EEA Born – at least 5 years | Non-EEA Born – less than 5 years | Non-EEA Born – at least 5 years |
| Owner Occupied | 71 | 11 | 60 | 21 | 59 |
| Private Rent | 12 | 79 | 24 | 66 | 19 |
| Social Housing | 17 | 10 | 16 | 13 | 22 |
| Total | 100 | 100 | 100 | 100 | 100 |
5. Newly arrived migrants have fewer homes in the ‘social housing’ sector than the indigenous population, but after five years their access to this type of housing – measured by the proportion of migrants with tenure in the social housing sector - is identical to, and for migrants from outside Europe - bigger, than the indigenous population (by five percentage points for migrants from outside Europe) - although around 90 per cent of all social housing tenancies are held by people born in the UK.
6. There are two main reasons for the high rate of tenure for social housing by non-EU migrants people - the relatively high number of those granted refugee status, and the fact that the housing ‘needs’ of migrants from outside Europe are often assessed as higher than others. The latter may be because overcrowding is higher amongst some migrant communities due to their larger family size.
7. Table 2 below, taken from the ONS ‘General Lifestyle Survey’[3] (see Data Sources), provides data on household size by ethnic group. Migrants, of course, define their ethnicity as distinct from ‘White British’. Approximately half of all international migrants to the UK in the period 1991 to 2008 originated either in the Indian Sub-Continent or New Commonwealth countries in Africa – countries where household size is significantly bigger than for most other ethnic groups.
Table 2: Average Household Size by Ethnic Group
| Ethnicity | Average Household Size |
| White British | 2.3 |
| Other White | 2.37 |
| Mixed Background | 2.39 |
| Indian | 2.96 |
| Pakistani | 4.11 |
| Bangladeshi | 4.96 |
| Other Asian | 3.03 |
| Chinese | 2.84 |
| Black Caribbean | 2.46 |
| Black African | 3.15 |
| Other Black | 2.29 |
| Other Ethnic Group | 2.69 |
| Average | 2.35 |
Supply of Housing
8. In England housing tenure patterns are dominated by the private sector – over 80 per cent of house tenures are either owner-occupied or are privately rented accommodation. The rest are provided by ‘Registered Social Landlords’ (RSL) – mostly Housing Associations – or Local Authorities, with a diminishing housing stock.
9. Between 1997 and 2007 (Table 3 below[4]), the total number of dwellings in England increased by over 1.5 million, with most of this growth occurring in the owner occupied sector whilst homes in the private rented sector increased by almost three-quarters of a million. Local Authority dwellings fell by 1.4 million while Registered Social Landlord accommodation only increased by 0.9 million leading to a fall of over half a million in the number of social homes. The growth in households slightly exceeded the increase in dwellings over this period, although in 2007 there were still almost 700,000 more dwellings than households.
Table 3: Supply of Dwellings and Households in England: 1997 – 2007 – ‘000s
| All Dwellings | o.w: Owner Occupied | o.w: Local Authority | o.w: ‘Registered Social Landlord’ | o.w: Private Rented | Households | |
| 1997 | 20622 | 14111 | 3401 | 985 | 2125 | 19874 |
| 1998 | 20788 | 14308 | 3309 | 1040 | 2121 | 20000 |
| 1999 | 20927 | 14518 | 3178 | 1146 | 2086 | 20156 |
| 2000 | 21075 | 14701 | 3012 | 1273 | 2089 | 20335 |
| 2001 | 21207 | 14838 | 2812 | 1424 | 2133 | 20523 |
| 2002 | 21337 | 14942 | 2706 | 1492 | 2197 | 20691 |
| 2003 | 21481 | 15088 | 2457 | 1651 | 2285 | 20831 |
| 2004 | 21636 | 15210 | 2335 | 1702 | 2389 | 20969 |
| 2005 | 21805 | 15312 | 2166 | 1802 | 2525 | 21170 |
| 2006 | 21990 | 15390 | 2086 | 1842 | 2673 | 21344 |
| 2007 | 22189 | 15449 | 1987 | 1886 | 2866 | 21527 |
| Difference: 1997 - 2007 | 1567 | 1339 | -1414 | 901 | 741 | 1653 |
Social Housing
10. Compared with other types of housing tenure, social housing is rationed by the supplier (either Local Authorities or Registered Social Landlords) – prospective tenants usually have to go on a waiting list, and priority is given to those whose ‘need’ for housing is judged to be greatest, with preference given to persons who are: homeless, living in unsanitary, overcrowded or unsatisfactory housing, or need to move on medical or welfare grounds.
11. The eligibility of migrants for social housing varies by nationality and immigration status:
- Migrants from EEA (European Economic Area)[5] countries are eligible to apply for social housing providing that they are working legally in the UK and have responsibility for children under the age of 18 in education.
- Migrants from non-EEA countries are usually ineligible to apply for social housing unless they have been granted indefinite leave to remain, which usually requires residence of at least 5 years in the UK.
- Refugees: those asylum seekers who have passed through the asylum system in the UK and have been granted refugee status or some other form of protection become eligible to be allocated social housing.
12. Some 90 per cent of tenancies in social housing are held by people born in the UK. Immigrants from outside the EEA who have been in the UK for at least five years have higher tenure rates for social housing than the indigenous population of the UK for reasons discussed above. Table 4 below[6] shows the proportion of migrant populations living in social housing by their country of birth in 2005/06. The figures for Ghana, Portugal, Bangladesh, Turkey and Somalia are particularly striking.
Table 4: Proportion of Population Living in Social Housing by Country of Birth, 2005/06
| Birth Country | Proportion of population living in social housing (%) |
| Poland | 8 |
| India | 14 |
| Sri Lanka | 14 |
| Pakistan | 15 |
| Phillipines | 15 |
| Cyprus | 16 |
| UK | 17 |
| Zimbabwe | 20 |
| Ireland | 21 |
| Uganda | 21 |
| Nigeria | 29 |
| Iran | 33 |
| Jamaica | 35 |
| Ghana | 39 |
| Portugal | 40 |
| Bangladesh | 41 |
| Turkey | 49 |
| Somalia | 80 |
13. The long – term decline of social housing in England has already been noted. Coupled with the imbalance between housing demand and supply, the result has been a significant increase in waiting lists for social housing. Social housing is under huge pressures: in the English regions, between 6 and 12 per cent of households in 2010 were on waiting lists for social housing. In England as a whole, the number was 8 per cent.
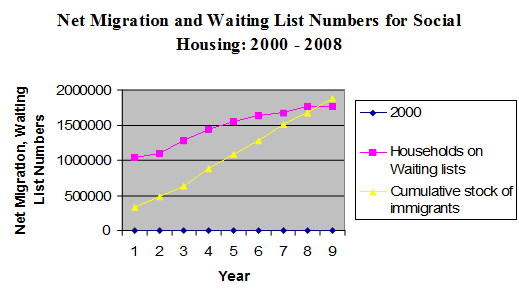
14. Between 2000 and 2009, the growth in household numbers on waiting lists increased by almost 725,000; in 2010 almost 1.8 million households in England were on waiting lists. In Yorkshire & the Humber, and in London, the two English regions where net immigration has been most intense, the proportion of households on such lists was 12 and 11 per cent respectively. The growth in the number of migrant households is clearly a factor in increasing social housing waiting lists. [7] Table 5 compares the numbers on waiting lists with increases in the stock of migrants in England between 2001 and 2009 and Figure 1 charts this.
Table 5: Growth in Waiting Lists and Migrant Numbers in England : 2001 – 2009
| Year | Cumulative Total of Households on Waiting Lists | Net International Migration | Cumulative Total of Migrants |
| 2000 | 1083720 | 158000 | |
| 2001 | 1039270 | 171000 | 329000 |
| 2002 | 1093340 | 153000 | 482000 |
| 2003 | 1270680 | 148000 | 630000 |
| 2004 | 1437740 | 245000 | 875000 |
| 2005 | 1547280 | 206000 | 1081000 |
| 2006 | 1634300 | 198000 | 1279000 |
| 2007 | 1674420 | 233000 | 1512000 |
| 2008 | 1769940 | 163000 | 1675000 |
| 2009 | 1763140 | 198000 | 1873000 |
Figure 1: Immigration and Waiting List Numbers for Social Housing
Projected Impacts
15. The Government in its latest twenty-five year projection of household numbers in England have projected that households will increase by 232,000 each year to 2033, an increase of 5.8 million households compared with 2008, with the biggest increases occurring in South East England, followed by London and North West England. The smallest increase in household numbers is projected to be in North East England.
16. Using the ‘Zero Net Migration’ variant projection it is possible to estimate the impact on housing demand over the period from 2008 to 2033. Without any net migration at all, the Government project household formation each year to decline to 149,000 which implies that net immigration over this period will lead to 83,000 additional households each year, or slightly over 2 million (2,075,000) over the twenty five year projection period.
17. Assuming – in line with the proportion of migrants who already have social housing tenures now after living for 5 or more years in the UK - that 20 per cent of migrant households will eventually need social housing, the additional number of units of social housing accommodation needed is twenty per cent of the just over two million additional migrant households formed, some 415,000 in total, equivalent to 16,600 a year or 45 every day.
Taxpayer Costs
18. An increase of this magnitude in social housing will have significant implications for public spending. Assuming, in line with current government spending, that provision of each social housing unit will be funded on average with around £60,000 of public sector grant[8], then the cost to the taxpayer of the additional housing required will be around £25 billion over this period, or one billion pounds a year. Of course, the net cost to the taxpayer will be less if migrants in social housing will become taxpayers themselves, but the scale of any offsetting effect is uncertain and possibly small: the House of Lords Select Committee investigation of the economic impacts of immigration noted (our emphasis):
“We also question the Government’s claim that immigration has generated fiscal benefits. Estimates of the fiscal impacts are critically dependent on who counts as an immigrant (or as a descendant of an immigrant) and on what items to include under costs and benefits. The overall fiscal impact of immigration is likely to be small, though this masks significant variations across different immigrant groups”.
19. Additionally, because of the widely recognised perverse effects of the benefits system, social housing tenants tend to have a disproportionately high rate of economic inactivity and unemployment – thus making it impossible for them to generate tax revenues for the Exchequer. This was acknowledged in the Government’s recent Comprehensive Spending Review (our emphasis):
“The Government believes social housing is an important element in fostering community cohesion and supporting households in housing need. The number of social rented properties fell between 1997 and 2009. The result has been rising housing waiting lists combined with growing numbers of workless households trapped in dependency on subsidized housing. In the 1970s, 11 per cent of households in social housing had no earner; by 2003-04, this had risen to 69 per cent.”
20. Finally, migrants overall have a lower employment rate and higher rate of ‘economic inactivity’ than the UK-born population.
Data Sources
House of Lords report on economic impacts of immigration: paragraph. 5 of the Abstract, available at page 5:
http://www.publications.parliament.uk/pa/ld200708/ldselect/ldeconaf/82/82.pdf
Employment Rates of Migrants: Table 3 page 22:
http://www.statistics.gov.uk/elmr/07_08/downloads/ELMR_Jul08_Clancy.pdf
Ethnic Minority and Migrant Households: Table 5.13 page 30:
http://www.ippr.org/publicationsandreports/publication.asp?id=563
Table 3.19
http://www.statistics.gov.uk/statbase/product.asp?vlnk=5756
Household Projections :Table 416 accessible from page 12:
http://www.communities.gov.uk/publications/corporate/statistics/2033household1110
Housing Supply: Table 14.1 page 217:
http://www.statistics.gov.uk/statbase/product.asp?vlnk=94
International Migration
Table 2.02 LTIM Country of Last or Next Residence
http://www.statistics.gov.uk/statbase/Product.asp?vlnk=507
Social Housing
Migration Advisory Committee: Table 8.1 page 199:
http://www.ukba.homeoffice.gov.uk/aboutus/workingwithus/indbodies/mac/
DCLG, Page 4:
http://www.communities.gov.uk/documents/statistics/pdf/1186234.pdf
HM Treasury, Box 2.2, page 49:
http://www.hm-treasury.gov.uk/spend_index.htm
Footnotes
- Social Housing (Local Authority Housing Statistics), Table 754. Available here and Hansard 22 Oct 2010 col 931 W
- Migration Advisory Committee: Table 8.1 page 199
- Office for National Statistics, ‘General Lifestyle Survey 2009’, Table 3.19. URL: http://www.statistics.gov.uk/.../GeneralLifestyleSurvey2009.pdf
- Office for National Statistics, ‘Annual Abstract of Statistics 2010’, Table 14.1, p. 217. URL: http://www.statistics.gov.uk/.../aa2010final.pdf
- The EEA comprises the 27 countries of the EU, together with Iceland, Lichtenstein and Norway.
- IPPR, ‘Britain’s Immigrants: An Economic Profile’, Proportion of Population living in Social Housing by Country of Birth 2005/6, Table 5.13, p. 30. URL: http://www.ippr.org/.../publication.asp
- Show -6 more...
- Social Housing (Local Authority Housing Statistics), Table 754. Available here and Hansard 22 Oct 2010 col 931 W
- Migration Advisory Committee: Table 8.1 page 199
- Office for National Statistics, ‘General Lifestyle Survey 2009’, Table 3.19. URL: http://www.statistics.gov.uk/.../GeneralLifestyleSurvey2009.pdf
- Office for National Statistics, ‘Annual Abstract of Statistics 2010’, Table 14.1, p. 217. URL: http://www.statistics.gov.uk/.../aa2010final.pdf
- The EEA comprises the 27 countries of the EU, together with Iceland, Lichtenstein and Norway.
- IPPR, ‘Britain’s Immigrants: An Economic Profile’, Proportion of Population living in Social Housing by Country of Birth 2005/6, Table 5.13, p. 30. URL: http://www.ippr.org/.../publication.asp
- Department for Communities and Local Government, Table 754 General needs social lettings made by housing associations (HAs) and local authority (LA) landlords, 2007/08 to 2009/10, England: nationality of household reference person. URL: http://www.communities.gov.uk/.../1804166.xls
- This excludes the costs of land acquisition. The Coalition Government aspires to reduce the amount of public funding per unit of social housing, but the timescale for doing this and the scale of any reduction in taxpayer contribution is uncertain.