The Impact of Immigration on Maternity Services in England
25 June, 2012
Summary
1 Between 2000 and 2010 births in England increased by over 114,000 – from 572,826 to 687,007. Immigration has been the key factor fuelling this increase: three quarters of the increase in births was to women born outside the UK. Overall, in 2010, over a quarter of all live births in England were to mothers born abroad. The proportion of such births has grown consistently every year in succession since 1990, doubling over the past decade – from approximately 92,000 in 2000 to almost 180,000 in 2010 – this is nearly 500 on average every day
2 Midwife numbers have not kept pace with the overall growth in numbers of births because governments before 2010 permitted high levels of net migration without making sure that maternity services received adequate staffing; consequently, there has been an acknowledged severe shortage of midwives for several years which has, in turn, led to concern about the quality of midwife services. Key indicators of pressures on maternity services and the resulting shortfall in midwives are shown in Table 1 below:
Table 1: Key Indicators of Pressures on Maternity Services in England: 2000 compared with 2010
| Key Indicator | Number | Percentage Increase |
| Increase in Live Births | 114,181 | 19.9 |
| Increase in Births to Mothers Born in the UK | 28,026 | 5.8 |
| Increase in Births to Mothers Born Outside the UK | 86,134 | 93.8 |
| Increase in the Shortage of Midwives | 1211 | 29.5 |
Source: ONS, NHS, MWUK calculations
3 The number of midwives in England over the past decade has been around a quarter less than the number needed to deliver satisfactory levels of maternity care. The current shortage of midwives is over 5,000.
4 Births to migrant mothers often involve disproportionate demands on maternity services for clinical and cultural reasons so the average cost is higher than for mothers born in the UK.
Trends in Births in England to Mothers Born Outside the UK : 1998 - 2010
5 Figure 1 below show the trend in births in England to foreign born women since 1998, comparing these with the birth trend to UK-born mothers. The table in Annex A shows the number of births in England over the decade to 2020-21 projected by the ONS in its 2010 Population Projection. The main points to note over this period are these:
- Between 1998 and 2010 the number of births in England increased by 14 per cent; there was a slight decrease in the number of births to women born in the UK, whilst births to women born outside the UK more than doubled. This is the major factor responsible for current pressures on maternity services
- The proportion of births to foreign born mothers, now nearly 26%, has been increasing consistently every year since 1990, when it was just under 12 per cent
- The average number of births each year over the ten year period 2011/12 to 2020/21is projected by the ONS to be almost 90,000 higher than the average for the decade 2001 – 2010.
Figure 1; Live Births to UK- and non-UK born Women in England: 1998-2010
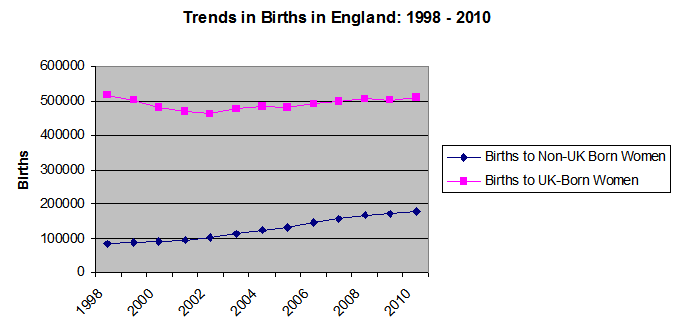
Source: ONS
Trends in Births in London
6 A fifth of all births in England are in London which is the English region where maternity services have been most heavily impacted by migration. Over 40 per cent of net migration is into London. Over the past five years the birth rate in London has increased by 10 per cent compared to the overall rate for England of 8 per cent, and the ONS projects that births in London might increase by a further 10,000 a year over the next ten years. .
7 The special demographic profile of mothers in London imposes disproportionately large impacts on maternity services. A majority of births in London are now to mothers who have been born overseas. Complications in pregnancy are more frequent for this group of women, as is a higher fertility rate. Both these factors impose significant additional demands on maternity services. Difficulties of communication are a further factor.
8 The table in Annex B shows the increase – between 1998 and 2010 – of the share of births in London Boroughs to migrant mothers. It should be noted that:
- In both Inner and Outer London Boroughs births to mothers born outside the UK constituted the majority in 2010
- Between 1998 and 2010 the share of births to mothers born outside the UK increased in Outer London Boroughs at twice the rate of Inner London Boroughs
- In one Borough – Barking & Dagenham – such births increased by over 40 percentage points
- The Borough with the highest share of such births in 2010 was Newham, where 76 per cent of births were to mothers born overseas
Costs of Maternity Services
9 In 2008 the Healthcare Commission published its report[2] reviewing maternity services in England, noting that the average cost of hospital care for each delivery was £2,088. This only included hospital costs, excluding ante-natal and some post-natal care after leaving hospital. Updating the figure using the official GDP deflator[3] to measure the increase in costs gives a figure for 2010/11 of approximately £2,250 for each birth. In 2010 the cost of all births to the NHS in England was therefore around £1.5 billion –under 2 per cent of the overall NHS
budget. Out of this, births to mothers born outside the UK had a cost to the NHS of over £400mn.
Trends in Midwife Numbers
10 Over the past decade (2001 – 2010) number of midwives in England has not kept up with the increase in births. Table 3 below shows that between 2001 and 2010 the numbers of births in England increased steadily every year, growing overall by 22 per cent, significantly less than the growth in midwife numbers, which increased by some 15 per cent.
Table 3: Numbers of Midwives in England, the Optimal Number Needed and the Resulting Shortage: 2000 – 2010
| Live Births | Numbers of Midwives (Full Time Equivalent) | Optimal Number of Midwives Required | Midwife Shortage – All Births | |
| 2000 | 572821 | 17662 | 21775 | 4113 |
| 2001 | 563744 | 18048 | 21422 | 3374 |
| 2002 | 565709 | 18119 | 21496 | 3377 |
| 2003 | 589851 | 18444 | 22451 | 4008 |
| 2004 | 607184 | 18854 | 23082 | 4228 |
| 2005 | 613028 | 18949 | 23301 | 4352 |
| 2006 | 635748 | 18862 | 24164 | 5302 |
| 2007 | 655357 | 19298 | 24910 | 5612 |
| 2008 | 672809 | 19639 | 25571 | 5932 |
| 2009 | 671058 | 20236 | 25506 | 5270 |
| 2010 | 687007 | 20790 | 26111 | 5321 |
Source: ONS; NHS.
Shortages of Midwives and Pressures on Maternity Services
11 There is general agreement that there has been a long-standing shortage of midwives in England. Medical Colleges involved with maternity care, together with the Royal College of Midwives (RCM)[4], recommended that the equivalent of between 36 and 40 midwives for each 1000 deliveries is the optimal staffing level needed to deliver one-to-one midwifery care, depending on the complexity of the cases being cared for. This implies that there has been a consistent shortage of midwives in England of around a quarter of staff numbers in the first eleven years of this century, with the RCM[5] calculating the shortage in England as being around 5,000 in 2009. The Healthcare Commission has found that almost a quarter of mothers were left alone during labour, a significant and revealing indicator of the magnitude of the shortage and reflecting the RCM’s calculation. Figure 2 shows the relationship in England between the growth in births to mothers born outside the UK and the shortage of midwives (as defined in para 16):
Figure 2: Trend of Births and Shortage of Midwives in England
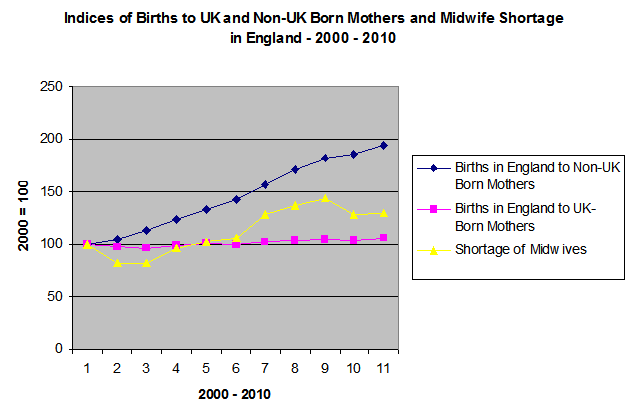
Source: ONS, NHS
12 The chart shows that the shortage of midwives increased every year from 2002 to 2008. The biggest factor causing this shortage was the increase in births to non-UK born mothers, which accounted for over 65,000 births, growing by over 60 per cent. Births to mothers born in the UK over the same period increased by almost 42,000 – a growth rate of some 9 per cent. Out of the total increase in births in England in this period, over 60 per cent were to mothers born outside the UK. Pressures in London may be particularly intense because of the special challenges of maternities there and the high cost of housing. The Local supervising Authority for midwives in London in 2010 reported that there was a vacancy rate of 16 per cent for midwives in London and that the average age of midwives there – 42 – meant that many were coming up to retirement[6].
13 The shortage of midwives is only one of the factors generally agreed to be behind the pressures on maternity services which have been experienced in many areas of England over the past decade. The Prime Minister, David Cameron, before the 2010 Election described midwifery as being an “overworked and demoralised” profession. The Healthcare Commission has reported midwives as feeling
“more pressure and frustration” than other medical staff and there is greater distress and unhappiness expressed among a greater proportion of midwives than medical staff.
14 Pressures on maternity services will inevitably risk an adverse
impact on the quality of maternity care. It is widely accepted that all women should have one-to-one midwife care during labour, but this is frequently not available.
15 A joint survey by The RCM and ‘NetMums’ found that, among over 3500 mothers surveyed, 43 per cent had reported that, after giving birth and on a postnatal ward, they did not have access to a midwife.
Methodology
16 The optimal number of midwives is calculated by assuming that 38 midwives are required for every 1000 deliveries if a satisfactory standard of care is to be provided. 38 is the average of the 36 to 40 range recommended by clinical experts. The shortage of midwives is calculated by subtracting the Full Time Equivalent of midwife numbers from the optimal number as calculated above.
Sources of Data
Births in England:
Data available on request from the ONS (VSOB Dept.) : 01329 444110
Cost of Deliveries:
http://data.gov.uk/dataset/payment-by-results-2010-11-national-tariff-information
http://www.cqc.org.uk/_db/_documents/Towards_better_births_200807221338.pdf
GDP Deflator Data:
http://www.hm-treasury.gov.uk/data_gdp_fig.htm
International Migration:
http://www.ons.gov.uk/ons/publications/re-reference-tables.html
Midwife Numbers in England :
http://www.ic.nhs.uk/.../nhs-staff-2000--2010-non-medical
Midwife Numbers in London:
ONS 2010 Population Projections
http://www.ons.gov.uk/.../2010-based-projections/index.html
Annex A
Live Births in England: 1998 – 2010 and Projected Births to 2020-21
| All Live Births | - To Women Born in the UK | - To Women Born Outside the UK | Births to Women Born Outside the UK as % of All Births | |
| 1998 | 602111 | 517321 | 84790 | 14 |
| 1999 | 589468 | 502094 | 87374 | 15 |
| 2000 | 572826 | 480965 | 91861 | 16 |
| 2001 | 563744 | 467536 | 96208 | 17.1 |
| 2002 | 565709 | 462103 | 103606 | 18.3 |
| 2003 | 589851 | 476592 | 113259 | 19.2 |
| 2004 | 607184 | 484982 | 122202 | 20.1 |
| 2005 | 613028 | 481453 | 131575 | 21.5 |
| 2006 | 635748 | 491646 | 144102 | 22.7 |
| 2007 | 655357 | 498367 | 156990 | 24 |
| 2008 | 672809 | 505573 | 167236 | 24.9 |
| 2009 | 671058 | 500570 | 170488 | 25.4 |
| 2010 | 687007 | 508996 | 177995 | 25.9 |
| 2011/12 | 707000 | NA | NA | NA |
| 2012/13 | 718000 | NA | NA | NA |
| 2013/14 | 723000 | NA | NA | NA |
| 2014/15 | 721000 | NA | NA | NA |
| 2015/16 | 719000 | NA | NA | NA |
| 2016/17 | 716000 | NA | NA | NA |
| 2017/18 | 712000 | NA | NA | NA |
| 2018/19 | 709000 | NA | NA | NA |
| 2019/20 | 708000 | NA | NA | NA |
| 2020/21 | 705000 | NA | NA | NA |
Source: ONS
Annex B
Percentage of Births in London Boroughs to Mothers Born OutsideUK
| Percentage 1998 | Percentage 2010 | Difference – Percentage Point | |
| INNER LONDON | 48 | 60 | 12 |
| Camden | 54 | 61 | 7 |
| Hackney | 46 | 52 | 6 |
| Hammersmith/ Fulham | 44 | 56 | 12 |
| Haringey | 50 | 65 | 15 |
| Islington | 39 | 52 | 13 |
| Kensington & Chelsea | 61 | 71 | 10 |
| Lambeth | 42 | 56 | 14 |
| Lewisham | 31 | 53 | 22 |
| Newham | 57 | 76 | 19 |
| Southwark | 45 | 60 | 15 |
| Tower Hamlets | 66 | 66 | 0 |
| Wandsworth | 33 | 48 | 15 |
| Westminster | 61 | 73 | 12 |
| OUTER LONDON | 30 | 53 | 23 |
| Barking/Dagenham | 16 | 58 | 42 |
| Barnet | 39 | 56 | 17 |
| Bexley | 9 | 29 | 20 |
| Brent | 60 | 74 | 14 |
| Bromley | 13 | 26 | 13 |
| Croydon | 26 | 47 | 21 |
| Ealing | 46 | 70 | 24 |
| Enfield | 31 | 59 | 28 |
| Greenwich | 25 | 54 | 29 |
| Harrow | 44 | 68 | 24 |
| Havering | 6 | 20 | 14 |
| Hillingdon | 23 | 53 | 30 |
| Hounslow | 38 | 64 | 26 |
| Kingston | 25 | 42 | 17 |
| Merton | 31 | 56 | 25 |
| Redbridge | 34 | 59 | 25 |
| Richmond | 25 | 37 | 12 |
| Sutton | 13 | 34 | 21 |
| Waltham Forest | 36 | 63 | 27 |
Source: ONS
Footnotes
- None
- Now part of the Care Quality Commission. “Towards Better Births – A Review of ternity Services in England” – available at: http://www.cqc.org.uk/.../Towards_better_births_200807221338.pdf
Further information on the cost of deliveries by clinical type (‘Normal Delivery’ , Caesarean Section etc.) is available from: http://data.gov.uk/dataset/payment-by-results-2010-11-national-tariff-information - GDP deflator measures economy-wide price changes. In 2008/09 it was 2.77, in 2009/10 1.63 and in 2010/11 2.97.
- Kings Fund – Safe Births: http://www.kingsfund.org.uk/publications/safe_births.html
- see this press release from the RCM: http://www.rcm.org.uk/.../rocketing-birthrate-fuels-english-regional-midwife-shortages-15-09-11/
- NHS London – Local Supervising Authorities for London. Annual report to the Nursing & Midwifery Council – August 2010
- Show -6 more...
- None
- Now part of the Care Quality Commission. “Towards Better Births – A Review of ternity Services in England” – available at: http://www.cqc.org.uk/.../Towards_better_births_200807221338.pdf
Further information on the cost of deliveries by clinical type (‘Normal Delivery’ , Caesarean Section etc.) is available from: http://data.gov.uk/dataset/payment-by-results-2010-11-national-tariff-information - GDP deflator measures economy-wide price changes. In 2008/09 it was 2.77, in 2009/10 1.63 and in 2010/11 2.97.
- Kings Fund – Safe Births: http://www.kingsfund.org.uk/publications/safe_births.html
- see this press release from the RCM: http://www.rcm.org.uk/.../rocketing-birthrate-fuels-english-regional-midwife-shortages-15-09-11/
- NHS London – Local Supervising Authorities for London. Annual report to the Nursing & Midwifery Council – August 2010