Who is getting local authority housing in London? Are some London councils telling the full story?

Updated 2 January, 2013
Summary
1. The English Housing Survey estimates that around 20% of all social housing stock in London is occupied by foreign nationals[1].
2. To examine the current impact of immigration it is necessary to look at who is being allocated social housing properties when they become available i.e. new lets[2].
3. However, local authorities are failing in their legal duty to provide information on the nationality of the tenant. Four London councils, owners of a quarter of council owned stock, provided no information at all to central government.
4. Other councils record lettings information but with the nationality data missing as the question is voluntary. The refusal rate for the rest of England is about 4%. In Haringey it was 90%.
5. In total only around 44% of new lets by local authorities include information on the nationality of the tenant.
6. This paper calls for:
- the nationality question to be made compulsory
- an enquiry into the allocation of new social housing lets by both housing associations and local councils in London.
- a re-opening of the debate as to the criteria under which social housing is allocated.
Introduction
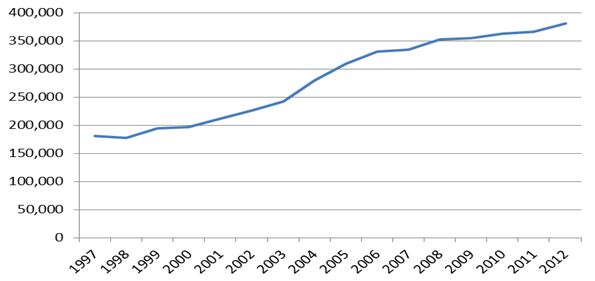
7. London faces a housing crisis. There is huge demand for social housing. Indeed, there are now over 380,000 households on the waiting lists[3].
Graph One: Households on London Local Authority Housing Waiting Lists
8. The waiting list is about ten times the number of properties let each year so most people on the waiting list will never get a social property and will remain housed in the private rented sector and may qualify for some assistance in paying the rent through housing allowance. The cap on housing allowance makes social housing even more advantageous. Social housing is a very scarce resource with intense public interest over who is granted social homes as they become available. It is therefore essential that there should be transparency about who are granted new lets.
9. The vast majority of social housing was built with the help of grants or subsidies provided by the taxpayer. Some local authorities and housing associations have received tax funding to help with improving stock and the areas around social housing. To receive these subsidies social housing providers have to ensure that their rents are below the market rate. The average rent for new lettings in a local authority property with three or more bedrooms is £109 a week,[4] a small fraction of the equivalent rent in the private sector where rents can range from £500 to several thousand pounds a week depending on the location.
10. This paper examines the official statistics on local authority social housing lets and nationality for the financial year 2011/12. It also reports the results of Migration Watch’s Freedom of Information requests to the Housing Departments of a number of London Boroughs.
11. London is a hugely diverse city with around one third of its residents born overseas. Many have become naturalised as British citizens. This paper looks solely at the current nationality of those being allocated social housing. If they are still foreign nationals they will either be more recent immigrants or they will have decided not to apply for British nationality.
Housing Stock
12. One quarter of all London’s housing is social housing. In 2011 there was a recorded housing stock in of around 3.3 million in London of which 781,000 were social houses[5]. This figure comprises 404,000 local authority owned properties and 376,000 housing association properties. Table A in Annex A presents the housing stock by London Borough.
The impact of immigration on housing stock
13. The English Housing Survey estimates that around 20% of all social housing stock in London is occupied by foreign nationals[6]. To examine the current impact of immigration it is necessary to look at who is being allocated social housing properties when they become available i.e. new lets.
Data collection on new lets
14. The Continuous Recording of Sales and Letting (CORE) is a national information source funded by the Department for Communities and Local Government (DCLG). It records information on the characteristics of new social housing tenants in both housing association and local authority homes as well as existing social housing tenants transferring to a new property. It is a legal requirement that local government should submit the relevant data to central government[7].
15. The data on letting is gathered by an interview with each new tenant after the home is allocated. The questionnaire is completed by the housing provider – either the local authority or the housing association. The interview is designed to record a number of characteristics about the new tenants - one of which is nationality but, importantly, this question is optional.
16. Lettings data is divided into “General Needs” and “Supported” Housing. Supported Housing is reserved for particular client groups who need either an adapted design or some level of supervision (e.g. housing for older people). A “standard” applicant on a local authority housing register would get general needs Housing. The majority of supported housing in London is owned by Housing Associations.
CORE data – Housing Associations
17. Housing Associations have long participated in the CORE survey and the DCLG state that there is 100% coverage of housing association lets. In 2011/12 there were 19,820 lets to new tenants with 8,300 in general needs housing and 11,520 in supported housing[8]. Overall, 75% were recorded as going to British nationals, 17% to foreign nationals, 3% refused and 5% unknown. There were also 13, 150 lets to existing tenants of social housing who moved social housing properties e.g. to one with more bedrooms. Of these 84% were recorded as being British nationals, 9% foreign nationals and 7% either refused or unknown.
CORE data – Local Authorities
18. To investigate the level of coverage of council lets in CORE a comparison was made with an alternative source of letting data; the Local Authority Housing Statistics Data Returns (LA Data Returns) which records the number of local authority lets[9]. This information was cross checked by submitting Freedom of Information (FOI) requests to each London borough asking how many lets were made in council owned properties and how many of these lets were recorded in CORE.
Results
19. The number of council lets recorded in CORE was 14,423. The number of lets recorded in the LA Data Returns was 21,910 (of which less than 2,000 were in Supported Housing). Therefore 7487 (34%) of council lets were not recorded in CORE.
20. In response to FOI requests, four London councils replied that they do not participate at all in CORE, despite it being a legal requirement to do so; these were Greenwich, Hackney, Lambeth and Newham. Together these councils own 89,355 properties or nearly a quarter of London’s local authority owned stock. These four councils stated that they had made 4,396 general needs lets in council owned properties in the financial year 2011/12. This information is supported by the LA Data Returns which report that these councils made 4440 general needs lets and 256 Supported lets. No information on the tenants for these lets was made available. Other councils only partially recorded their lets in CORE. For example Camden replied to an FOI stating that it had let 956 ‘General Needs’ properties but that only 574 were recorded in CORE.
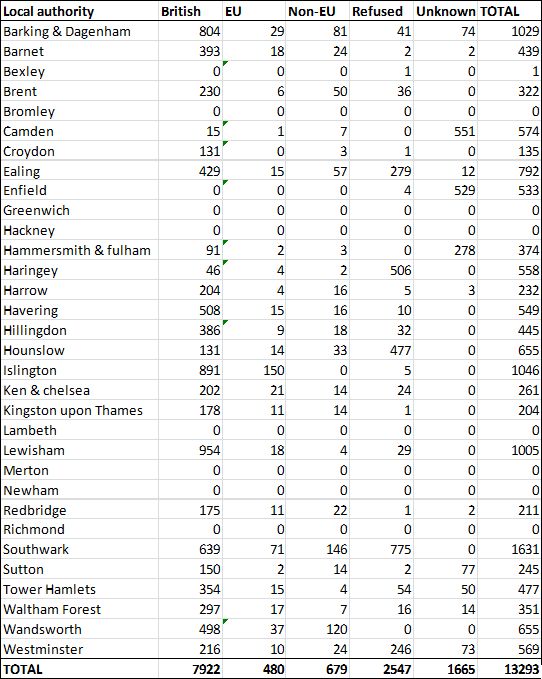
21. The question on nationality is optional as the new tenant can refuse to answer this question. The refusal rate for the local authority data covering the rest of England is 4%. However, in London the figure is 19%. A further 13% are marked as ‘unknown’. Therefore a full 32% of those local authority lets recorded in CORE had no nationality data. Taking into account both the partial recording of lets in CORE and the partial recording of nationality data for those lets that were recorded, only 9730 (44%) of the estimated 21,910 lets (para 19) had details recorded of the nationality of the tenant. Table B in Annex A sets out the nationality data on those general needs local authority lets that were submitted to CORE. Some councils have recorded the majority of their lets with the nationality data as either unknown or refused. It is not clear why this should be the case when neighbouring councils have been able to submit nationality data.
Ealing and Haringey
22. In Migration Watch briefing paper 7.14 Ealing and Haringey were highlighted as a having given a high proportion of social housing lets to foreign nationals in the financial year 2010/11[10]. Table One and Table Two below set out the CORE data submitted by Ealing and Haringey for the financial years 2010/11 and 2011/12.
Table One: Nationality of lets submitted to CORE by Ealing Council
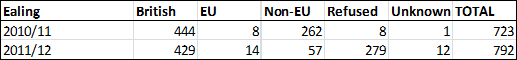
Table Two: Nationality of lets submitted to CORE by Haringey Council
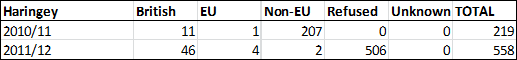
23. For the 2011/12 data the number of lets recorded as going to Non-EU nationals has fallen significantly while the number marked as refused has increased dramatically. The reasons for this change require further investigation.
Conclusion
24. The official data is extremely partial and does not provide even basic information on the impact of immigration on social housing lets. Given the intense public interest in this issue this needs to be corrected as soon as possible.
ANNEX A
Table A – Social Housing Stock by London Borough[11]
| Local Authority (incl. owned by other LAs) | Housing association | |
| Barking and Dagenham | 19,173 | 3,717 |
| Barnet | 11,202 | 7,467 |
| Bexley | 13 | 13,596 |
| Brent | 9,115 | 15,972 |
| Bromley | 92 | 18,861 |
| Camden | 23,596 | 11,389 |
| City of London | 430 | 539 |
| Croydon | 14,024 | 10,981 |
| Ealing | 13,060 | 9,891 |
| Enfield | 11,482 | 7,350 |
| Greenwich | 23,404 | 11,502 |
| Hackney | 22,772 | 22,206 |
| Hammersmith and Fulham | 13,113 | 12,886 |
| Haringey | 16,623 | 10,757 |
| Harrow | 4,991 | 3,878 |
| Havering | 10,129 | 3,650 |
| Hillingdon | 10,479 | 6,412 |
| Hounslow | 0 | 7,149 |
| Islington | 26,328 | 15,286 |
| Kensington and Chelsea | 6,922 | 13,199 |
| Kingston upon Thames | 4,841 | 2,443 |
| Lambeth | 25,612 | 22,975 |
| Lewisham | 15,526 | 21,118 |
| Merton | 4 | 11,515 |
| Newham | 17,547 | 13,065 |
| Redbridge | 5,111 | 4,457 |
| Richmond upon Thames | 0 | 9,937 |
| Southwark | 39,845 | 15,221 |
| Sutton | 6,409 | 4,529 |
| Tower Hamlets | 12,502 | 28,627 |
| Waltham Forest | 10,365 | 11,016 |
| Wandsworth | 17,328 | 9,870 |
| Westminster | 12,187 | 15,338 |
| TOTAL | 404,225 | 376,799 |
Table B – Local authority “General Needs” Lets submitted to CORE[12]
Footnotes
- http://www.publications.parliament.uk/pa/.../120517w0001.htm
- London is a hugely diverse city with around one third of its residents born overseas. Many have become naturalised as British citizens. This paper solely looks at the number of foreign nationals getting social housing. which excludes those foreign born who have taken British nationality
- DCLG Housing Statistical Release, 21st September 2012, Table 600 https://www.gov.uk/government/publications/local-authority-housing-statistics-for-england-2011-to-2012
- DCLG Housing Statistical Release, 21st September 2012, Table 2b https://www.gov.uk/government/publications/social-housing-lettings-and-sales-in-england-2011-to-2012-continuous-recording
- Table 100 Dwelling stock: Number of Dwellings by Tenure and district: England; 2011 https://www.gov.uk/government/statistical-data-sets/live-tables-on-dwelling-stock-including-vacants
- http://www.publications.parliament.uk/pa/.../text/120517w0001.htm
- Show -6 more...
- http://www.publications.parliament.uk/pa/.../120517w0001.htm
- London is a hugely diverse city with around one third of its residents born overseas. Many have become naturalised as British citizens. This paper solely looks at the number of foreign nationals getting social housing. which excludes those foreign born who have taken British nationality
- DCLG Housing Statistical Release, 21st September 2012, Table 600 https://www.gov.uk/government/publications/local-authority-housing-statistics-for-england-2011-to-2012
- DCLG Housing Statistical Release, 21st September 2012, Table 2b https://www.gov.uk/government/publications/social-housing-lettings-and-sales-in-england-2011-to-2012-continuous-recording
- Table 100 Dwelling stock: Number of Dwellings by Tenure and district: England; 2011 https://www.gov.uk/government/statistical-data-sets/live-tables-on-dwelling-stock-including-vacants
- http://www.publications.parliament.uk/pa/.../text/120517w0001.htm
- CORE is a data item on the Single Data List https://www.gov.uk/government/policies/.../supporting-pages/single-data-list
- CORE data, https://core.communities.gov.uk/ letting data split into new and existing tenants by looking at previous tenure of tenant.
- Worksheet D, Local authority Housing Statistics Data Returns for 2011 to 2012 https://www.gov.uk/government/publications/local-authority-housing-statistics-for-england-2011-to-2012
- http://www.migrationwatchuk.org/briefingPaper/document/260
- Table 100 Dwelling stock: Number of Dwellings by Tenure and district: England; 2011 https://www.gov.uk/government/statistical-data-sets/live-tables-on-dwelling-stock-including-vacants
- CORE data analysed by nationality, https://core.communities.gov.uk/