International Students: The Brightest and the Best?
18 September, 2012
Summary
1. Students are by far the largest category of migrant to the UK. Non-EU students have roughly trebled in the past ten years, especially following the introduction of the Points Based System in 2008. Genuine students are of economic value to the UK – they are an asset to both campus life and their local economies – provided that they go home at the end of their studies.
2. Students coming to the UK are often portrayed as the brightest and the best. However, closer study of the Higher Education statistics shows that only two thirds (64%) of non- EU arrivals went to a university.
3. Of all student arrivals only one in eight studied at a Russell Group university and about one in twenty students went to study at a top ten university.
4.There has been a rapid growth in graduate students at less well known universities, perhaps attracted by a scheme, now tightened up somewhat, that offered virtually free access to the British labour market.
Introduction
5. This paper sets out the number of students that come to the UK to study and examines the nature of the student population by origin, institution, and level of study.
Increase in Student Numbers
6. Students are by far the largest category of immigrants to the UK. There are two broad categories – Tier 4 for those coming for more than one year and “student visitor” for those coming for less than a year. There are three ways of measuring student migration to the UK: Home Office visa data; arrivals data; and the International Passenger Survey (IPS) – but there is still no measure of student departures and no check on individuals as they leave.
(a)Visas
The Home Office statistics for the last calendar year show that in 2011 323,000 people were granted these two kinds of student visa (see Table 1 below).
Table 1. Student Visas Issued 2011, (Home Office)
| PBS Tier 4 Main | 236,961 |
| PBS Tier 4 Dependant | 24,373 |
| Student Visitor | 61,319 |
| TOTAL | 322,653 |
(b)Arrivals
Students are by far the largest category of immigrants arriving in the UK. In 2010, the latest full year for which statistics are available, over half a million non-EU students and their dependants arrived in the UK, including those who wished to study for up to a year on the student visitor route. The number of arrivals (Table 2 below) is higher than the number of visas issued as not all students require a visa to study. For example non-visa nationals such as Australian and New Zealand citizens do not require a student visitor visa prior to entry. Nor are EU students included as they do not need a visa.
Table 2. Student Arrivals to the UK, 2010 (Home Office)
| PBS Tier 4 main | 271,500 |
| PBS Tier 4 Dependant | 23,500 |
| Student Visitor | 240,000 |
| TOTAL | 535,000 |
(c)IPS
Not all of those granted Tier 4 visas appear in the migration statistics which are based on the International Passenger Survey; this measures, on a sample basis, those who say that they are coming to study for more than a year. On this measure 180,000 non-EU students came to the UK for study in 2011. Some may have decided not to come, others may have been missed by the survey.
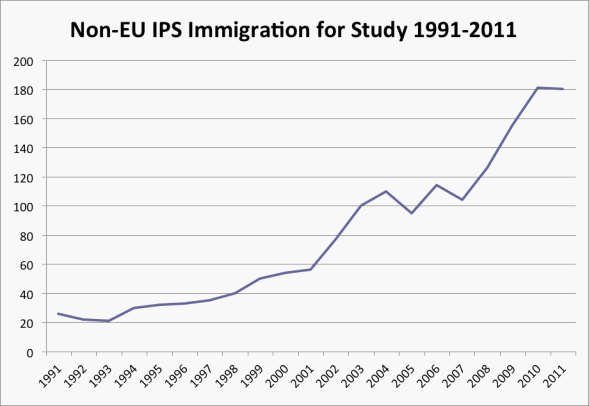
7. According to the IPS, non-EU student numbers have more than trebled since 2000 when the total was 54,000.
8. This period included a dramatic increase following the introduction of the Points Based System in 2008. In 2007 about 104,000 students were recorded as coming to the UK from outside the EU for the purposes of study. This figure rose to 180,000 in 2011, a rise of 73% in four years.[1]
Figure 1. Non-EU IPS Immigration for Study, 1991- 2011, ONS
Increase in Students by Region of Origin, 2008 to Present
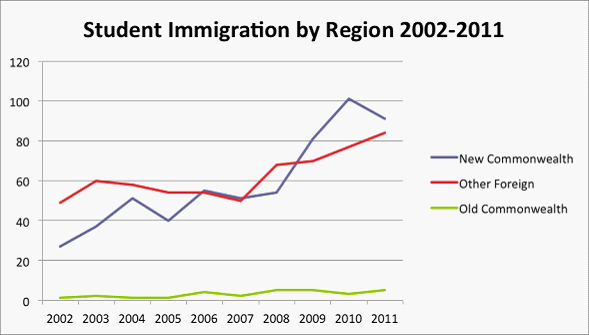
9. According to the IPS, student immigration from the New Commonwealth[2] has increased almost fivefold from 19,000 in 2001 to 91,000 in 2011, including a sharp increase following the introduction of the PBS in 2008, increasing by 78% between 2007 and 2011. [3] Students from the rest of the world (“other foreign”) have also increased significantly since the beginning of the decade while numbers from the Old Commonwealth have remained static, as figure 2 below demonstrates.
Figure 2. IPS Immigration by region, 2002-11
Students by Country of Birth- Tier 4 Visa Grants
10. Large numbers of student visa holders to the UK are from China, Pakistan and India and they predominantly arrive on a Tier 4 visa rather than a student visitor visa; they comprised 42% of the total number of student visas issued in 2011.
Table 3. Tier 4 Student Visas Issued, 2011 (Home Office)
| Tier 4 Visas, 2011 | ||
| Country | Visas Issues | |
| 1 | China | 52,485 |
| 2 | Pakistan | 35,664 |
| 3 | India | 34,826 |
| 4 | United States | 14,475 |
| 5 | Nigeria | 12,115 |
| 6 | Saudi Arabia | 10,087 |
| 7 | Malaysia | 7,418 |
| 8 | Hong Kong | 7,237 |
| 9 | Bangladesh | 6,450 |
| 10 | South Korea | 5,341 |
| 11 | Sri Lanka | 4,929 |
| 12 | Thailand | 4,903 |
Tier 4 Visa Holders by Type of Institution
11. There are no official data on the number of students who go to universities as opposed to colleges since the same Tier 4 visa is granted for all types of study longer than 11 months. However there are other sources of information that help to understand the student population better in terms of their place of study.
(a) Universities
12. Data from the Higher Education Statistics Authority (HESA) shows that in the academic year 2010/11 there were 298,000 non-EU students at universities, 164,000 of whom were studying at postgraduate level and 134,000 at undergraduate level. This is an increase of 61% from 2002/03 when there were 185,000 non-EU students enrolled at UK universities.
13. There are no Home Office statistics on the number or proportion of Tier 4 students who enter the country to study at universities rather than colleges. However, HESA data on first year enrolments suggests that 174,000 non-EU first year students enrolled at a University in 2010/11, comprising 105,000 at postgraduate level and 69,000 at undergraduate level.[4] This compares to 271,500 student arrivals in 2010. University enrolments therefore made up about two thirds of student arrivals. This however, can only be an approximation as it assumes that all first year postgraduate enrolments arrived in that year. In reality a number will already be in the country having progressed from undergraduate study. Likewise, some undergraduate students would have entered in a previous year in order to study a pathway course.
(b) Colleges
14. No reliable figures exist for the number of students enrolled in colleges. However, the Home Office have advised that, of the current inflow, 130,000 went to study at a university and 90,000 to colleges. The first of these two figures is lower than the number of enrolments (paragraph 12 above) because some students will have transferred from foundation courses. Likewise some postgraduates would have progressed from an undergraduate course having arrived in some previous year.
Students at Universities – Russell and Non Russell Group Institutions
15. In 2010/11 just one third of the stock of non-EU students studying at university were studying at Russell Group universities[5] – 103,000 of the total 298,000 enrolled at all UK universities (See Annex A) This proportion has remained roughly constant over the last nine academic years. In 2010/11 the stock of non-EU students at top ten universities was 40,755.
16. There are no available statistics on the breakdown of first year enrolments by university. We have therefore had to assume that undergraduates spend on average three years at university. For postgraduates, we have assumed the same average. This would result in an annual inflow to the Russell Group of 34,300 and 13,600 to the top ten. Thus only approximately 12.5% of new arrivals went to a Russell Group university while 5% went to a top ten university.
Growth of University Students
17. In 2002/3 there were 185,000 non-EU students studying at UK universities. By 2010/11 this had increased by 61% to 298,000. Taking undergraduate and post graduate together, the rise occurred in similar proportions at both Russell Group and non-Russell Group institutions. See figure 3 below.
Figure 3. Non-EU Students at Russell Group and Non-Russell group Institutions 2002/03 - 2010/11
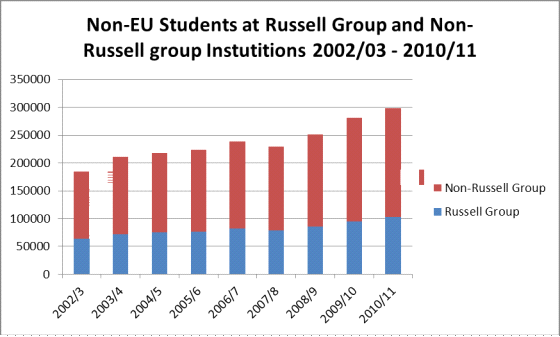
18. The pattern was different, however, when postgraduates and undergraduates were looked at separately. In 2002/03 there were 41,000 postgraduates at Russell Group universities. In 2010/11 there were 59,000 – an increase of 46%. The number of non-EU undergraduates at the Russell Group has increased by 90% over this period, from 23,000 to 43,000.
19. At non Russell Group institutions the reverse has occurred. Non-EU undergraduate students have increased by 45% from 63,000 in 2002/03 to 91,000 in 2010/11 whereas non-EU postgraduates have increased by 78% from 59,000 in 2002/03 to 104,000 in 2010/11. Indeed some non Russell Group institutions have a very large number of non-EU postgraduate students who constitute the vast majority of their postgraduate population. For example, 72% of postgraduate students at Cardiff Metropolitan University are from outside the EU, and in numbers terms – 3,660 – amount to more than those at the London School of Economics (3,125) or Oxford University (3,410). See Annex B for a full list of universities with the highest proportion of non-EU undergraduates and postgraduates.
20. This is perhaps explained by the introduction of the post study work (PSW) route which allowed students to study any subject at any higher education institution for one year, and then switch to a post study work visa, allowing the individual to work in any job at any level for two years while seeking long term employment. This route may have attracted students to the less prestigious universities. In its first year, 2008, 20,000 students were granted PSW visas, rising to 34,000 the following year. In 2011, the latest full calendar year available, 44,000 PSW visas were issued.[6] Since April 2012, the Post Study Work route has been closed to new applicants. However students on a PBS Tier 4 Visa are still able to switch into a Tier 2 Work Permit if they find employment with a sponsor paying a minimum of £20,000 p. a. There is no limit on the number of students who can switch into this category.
Conclusion
21. The student population has grown significantly in recent years – the IPS shows that it has trebled in the last ten years. This growth has come largely from New Commonwealth and “other foreign” countries. Growth has occurred at both Russell Group Universities and non-Russell Group, but there is a striking difference in their intake of non-EU students. The Russell Group have increased their postgraduate numbers by 46% and their undergraduates by 90% in the last eight years. The non-Russell Group has done the opposite; postgraduates have increased by 78% and undergraduates by 45%. Some less well known universities now have a very high proportion of non-EU graduates. The availability of post study work permits could well have been a major factor attracting those seeking entry to the UK labour market (and eventual settlement) rather than “the brightest and the best”. Indeed only one in eight non-EU student arrivals attended a Russell Group University and less than one in twenty attended one of the top ten universities.
Annex A
Non-EU undergraduates and postgraduates at Russell Group institutions
| 2010/2011 | |||
| UG | PG | Total | |
| University of Birmingham | 1410 | 3670 | 5080 |
| University of Bristol | 1315 | 1895 | 3210 |
| University of Cambridge | 1215 | 2660 | 3875 |
| Cardiff University | 1775 | 2540 | 4315 |
| Durham University | 875 | 1640 | 2515 |
| University of Edinburgh | 2195 | 2485 | 4680 |
| University of Exeter | 2200 | 1340 | 3540 |
| University of Glasgow | 805 | 1940 | 2745 |
| Imperial College London | 2285 | 1630 | 3915 |
| King's College London | 1690 | 2165 | 3855 |
| University of Leeds | 1545 | 2840 | 4385 |
| University of Liverpool | 1835 | 1450 | 3285 |
| London School of Economics | 1440 | 3125 | 4565 |
| University of Manchester | 4000 | 4160 | 8160 |
| Newcastle University | 1675 | 2410 | 4085 |
| University of Nottingham | 3050 | 3705 | 6755 |
| University of Oxford | 1090 | 3410 | 4500 |
| Queen Mary University | 1580 | 1330 | 2910 |
| Queen's University Belfast | 480 | 680 | 1160 |
| University of Sheffield | 1925 | 3770 | 5695 |
| University of Southampton | 1470 | 2435 | 3905 |
| University College London | 3435 | 2815 | 6250 |
| University of Warwick | 2980 | 3370 | 6350 |
| University of York | 905 | 2010 | 2915 |
| Total Russell Group Students | 43175 | 59475 | 102650 |
Annex B
Universities with highest proportion of undergraduate students from outside the EU, 2010/11
| Undergraduate | ||||||
| Institution | UK | EU | Non-EU | Total | % Non-EU | |
| 1 | Buckingham University | 400 | 100 | 475 | 975 | 49% |
| 2 | London School of Economics | 2215 | 325 | 1440 | 3975 | 36% |
| 3 | Royal Academy of Music | 195 | 50 | 90 | 335 | 27% |
| 4 | St Andrews University | 4700 | 715 | 1955 | 7370 | 27% |
| 5 | Imperial College London | 5645 | 935 | 2285 | 8865 | 26% |
| 6 | University College London | 8780 | 1185 | 3435 | 13405 | 26% |
| 7 | University of the Arts, London | 8680 | 1500 | 3440 | 13620 | 25% |
| 8 | SOAS | 1810 | 425 | 710 | 2940 | 24% |
| 9 | Heriot-Watt University | 4495 | 590 | 1190 | 6275 | 19% |
| 10 | Royal College of Music | 225 | 75 | 70 | 375 | 19% |
| 11 | Glynd?r University | 4775 | 1445 | 1350 | 7570 | 18% |
| 12 | L'pool Institute for Performing Arts | 540 | 25 | 120 | 685 | 18% |
| 13 | Aston University | 6240 | 490 | 1405 | 8130 | 17% |
| 14 | The City University | 7265 | 755 | 1605 | 9625 | 17% |
| 15 | Warwick University | 13825 | 1165 | 2980 | 17970 | 17% |
| 16 | Exeter University | 10685 | 520 | 2200 | 13405 | 16% |
| 17 | Glasgow School of Art | 1100 | 140 | 230 | 1475 | 16% |
Universities with the highest proportion of postgraduate students from outside the EU, 2010/11
| Postgraduate | ||||||
| Institution | UK | EU | Non-EU | Total | % Non-EU | |
| 1 | Cardiff Metropolitan University | 1345 | 95 | 3660 | 5100 | 72% |
| 2 | University College Birmingham | 95 | 45 | 315 | 460 | 68% |
| 3 | University of Bedfordshire | 1955 | 200 | 3225 | 5380 | 60% |
| 4 | London School of Economics | 1010 | 1415 | 3125 | 5550 | 56% |
| 5 | London Business School | 555 | 360 | 1155 | 2070 | 56% |
| 6 | The University of Greenwich | 2360 | 245 | 3220 | 5825 | 55% |
| 7 | Glynd?r University | 635 | 45 | 710 | 1390 | 51% |
| 8 | Aston University | 1340 | 285 | 1565 | 3190 | 49% |
| 9 | Coventry University | 2230 | 425 | 2485 | 5145 | 48% |
| 10 | Sunderland University | 1345 | 140 | 1375 | 2860 | 48% |
| 11 | Brunel University | 2380 | 525 | 2675 | 5580 | 48% |
| 12 | St Andrews University | 775 | 410 | 985 | 2170 | 45% |
| 13 | Hull University | 1955 | 255 | 1625 | 3840 | 42% |
| 14 | Robert Gordon University | 2095 | 225 | 1700 | 4020 | 42% |
| 15 | Sheffield University | 4525 | 660 | 3770 | 8950 | 42% |
| 16 | University of Wales Trinity Saint David | 805 | 80 | 640 | 1520 | 42% |
| 17 | Edinburgh College of Art | 180 | 55 | 170 | 405 | 42% |
| 18 | Surrey University | 2405 | 890 | 2285 | 5580 | 41% |
| 19 | University of Abertay Dundee | 220 | 50 | 185 | 455 | 41% |
| 20 | London School of Hygiene and Tropical Medicine | 630 | 130 | 515 | 1275 | 40% |
| 21 | Oxford University | 3730 | 1385 | 3410 | 8525 | 40% |
| 22 | York University | 2610 | 425 | 2010 | 5045 | 40% |
| 23 | University of Newcastle-upon-Tyne | 3245 | 445 | 2410 | 6095 | 40% |
Top 10 Universities (Sunday Times Guide) and the proportion of non-EU students enrolled in each institution at undergraduate and postgraduate level, 2010/11
| Undergraduate | Postgraduate | All students | |||||||||
| Institution | UK | Non-EU | % Non-EU | Total | UK | Non-EU | % Non-EU | Total | Non-EU | Total | % Non-EU |
| Cambridge Uni | 10200 | 1215 | 10% | 12300 | 4110 | 2660 | 33% | 8095 | 3875 | 20395 | 19% |
| Oxford Uni | 14565 | 1090 | 7% | 16390 | 3730 | 3410 | 40% | 8525 | 4500 | 24915 | 18% |
| Durham Uni | 10220 | 875 | 8% | 11450 | 2780 | 1640 | 33% | 4905 | 2515 | 16355 | 15% |
| LSE | 2215 | 1440 | 36% | 3975 | 1010 | 3125 | 56% | 5550 | 4565 | 9525 | 48% |
| Bath Uni | 7915 | 1290 | 13% | 10075 | 2950 | 1720 | 33% | 5245 | 3010 | 15320 | 20% |
| St Andrews Uni | 4700 | 1955 | 27% | 7370 | 775 | 985 | 45% | 2170 | 2940 | 9540 | 31% |
| UCL | 8780 | 3435 | 26% | 13405 | 6550 | 2815 | 25% | 11275 | 6250 | 24680 | 25% |
| Warwick Uni | 13825 | 2980 | 17% | 17970 | 5770 | 3370 | 33% | 10195 | 6350 | 28165 | 23% |
| Exeter Uni | 10685 | 2200 | 16% | 13405 | 2875 | 1340 | 29% | 4630 | 3540 | 18035 | 20% |
| Bristol Uni | 12355 | 1315 | 9% | 14070 | 3435 | 1895 | 32% | 5920 | 3210 | 19990 | 16% |
Footnotes
- ONS, International Passenger Survey estimates of long-term international migration, Table 3 Citizenship by main reason for migration. URL: http://www.ons.gov.uk/.../provisional-long-term-international-migration--ltim--estimates.xls
- New Commonwealth is the Commonwealth excluding Australia, New Zealand, South Africa and Canada.
- Figure for 2011 relates to YE September 2011 and therefore there is some overlap between 2010 and 2011. These are not comparable figures however the point remains that the numbers from the New Commonwealth increased substantially following the introduction of the PBS.
- HESA, Students and Qualifies Statistics, Table 2 – First year student enrolments on HE courses by level of study, mode of study and domicile 2006/07 – 2010/11.
- The Russell Group Universities are the 24 leading UK universities comprising the University of Birmingham, University of Bristol, University of Cambridge, Cardiff University, Durham University, University of Edinburgh, University of Exeter, University of Glasgow, Imperial College London, King's College London, University of Leeds, University of Liverpool, London School of Economics, University of Manchester, Newcastle University, University of Nottingham, University of Oxford, Queen Mary University, Queen's University Belfast, University of Sheffield, University of Southampton, University College London, University of Warwick and the University of York.
- Home Office Statistics, Extensions of Stay, Table ex.02.w, Grants of an extension of stay by category and country of nationality: Work. URL: http://www.homeoffice.gov.uk/publications/.../extensions-q2-2012-tabs
- Show -6 more...
- ONS, International Passenger Survey estimates of long-term international migration, Table 3 Citizenship by main reason for migration. URL: http://www.ons.gov.uk/.../provisional-long-term-international-migration--ltim--estimates.xls
- New Commonwealth is the Commonwealth excluding Australia, New Zealand, South Africa and Canada.
- Figure for 2011 relates to YE September 2011 and therefore there is some overlap between 2010 and 2011. These are not comparable figures however the point remains that the numbers from the New Commonwealth increased substantially following the introduction of the PBS.
- HESA, Students and Qualifies Statistics, Table 2 – First year student enrolments on HE courses by level of study, mode of study and domicile 2006/07 – 2010/11.
- The Russell Group Universities are the 24 leading UK universities comprising the University of Birmingham, University of Bristol, University of Cambridge, Cardiff University, Durham University, University of Edinburgh, University of Exeter, University of Glasgow, Imperial College London, King's College London, University of Leeds, University of Liverpool, London School of Economics, University of Manchester, Newcastle University, University of Nottingham, University of Oxford, Queen Mary University, Queen's University Belfast, University of Sheffield, University of Southampton, University College London, University of Warwick and the University of York.
- Home Office Statistics, Extensions of Stay, Table ex.02.w, Grants of an extension of stay by category and country of nationality: Work. URL: http://www.homeoffice.gov.uk/publications/.../extensions-q2-2012-tabs