Asylum: the outcome
23 August, 2011
Summary
- The chaos which developed in a system swamped by the number of applications at the turn of the century means that only broad conclusions can be drawn.
- 660,000 decisions were made over the period of 1997-2010 as a result of which 23 percent of claimants were removed (including voluntary returns).
- Taking the period as a whole, nearly 77 percent of those who claimed asylum are still in the UK, just over half of them illegally.
- Cohort analysis by the Home Office covering 2004 to 2009 showed that 23 percent were granted asylum (including on appeal) while a further 10 percent were given some form of protection. 62 percent were refused. In 6 percent of cases a decision has not been reached or is unknown.
- In the period 2008 to 2010, 59 percent of applications were lodged only after the applicant had been detected, suggesting that seeking refuge was not the primary purpose for coming to the UK.
- Eurostat data for 2010 suggests that, in France, 14 percent of applications were granted asylum at the first instance compared to 27 percent in the UK. In 2009 the overall percentage of grants, including on appeal, was 19 percent in France and 28 percent in Britain.
- The cost of the asylum system since 1999 is close to £10 billion, including legal aid and the cost of the courts involved.
Introduction
1. It is not possible to make a precise assessment of the outcome of asylum claims in recent years. This is mainly due to the revelation in 2006 that around 400,000 case files had been left sitting in a warehouse. These “legacy” cases have now been examined; 11 percent of the applicants have been removed while 42 percent have been granted settlement. It is not possible to know how these numbers fit with the official asylum figures published over the years.
2. A second difficulty arises from the fact that many cases are not decided in the year of application. There will therefore be loose ends at the beginning and end of the period. Home Office cohort analysis (see paragraph 13 below) is intended to overcome this difficulty.
Applications
3. In 1997 applications for asylum totalled 32,500, having remained between 22,000 and 45,000 since 1991.[1] Within two years applications began to increase with over 70,000 lodged in 1999.[2] Between 1997 and 2010, applications for asylum in the UK totalled 610,000 (609,465).[3] In 2002 alone, almost 85,000 applications were received.
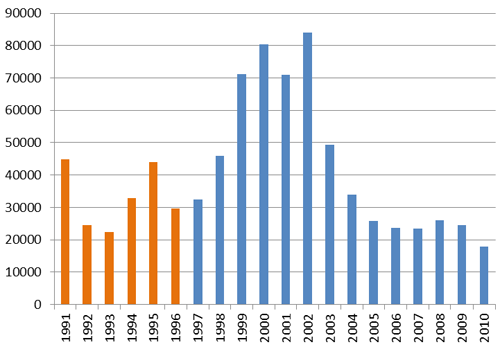
Figure 1. Principal Asylum Applications 1991-2010[4]
Dependants
4. In addition to principal asylum applicants, a further 24 percent entered the UK as dependants of a claimant.[5] Moreover, asylum statistics only capture those dependants who are in the UK at the time of the application and do not include those dependants who arrive later. This number is unknown.
Initial Decisions 1997-2010
5. Over this period 660,000 initial decisions were made on applications for asylum. Of these, only 11 percent were granted asylum (71,720). Over 86,000 (86,250) individuals were granted exceptional leave to remain, humanitarian protection or discretionary leave all of which bestow the right to remain in the UK. The Home Office refused 72% of applications decided during this period, or almost half a million (478,385).
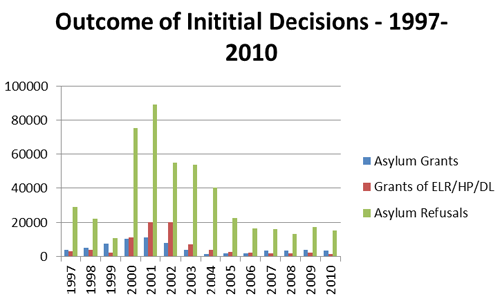
Figure 2. Initial Grants of Asylum, Grants of ELR/HP and DL, and Refusals 1997-2010
Appeals lodged 1997-2010, (Allowed and Refused)
6. Those refused asylum have a right of appeal. The number of appeals lodged also rose sharply. In total, over 700,000 appeals were submitted (700,515), with over 100,000 appeals submitted every year between 2001 and 2003. Of those appeals determined by the Courts (438,385), 19 percent were allowed (85,090). Over 18,000 were withdrawn during the judicial process (18,110). Over 75 percent of appeals were dismissed (335,145).
Total Asylum Grants and Grants of Protection 1997-2010
7. In total, 72,000 people were granted asylum on initial decision, 85,000 were granted asylum on appeal. Together they accounted for 25.7% of the 610,000 applications received. A further 86,000 (14%) were granted exceptional leave to remain, humanitarian protection or discretionary leave. In total therefore, 243,000 (243,060) applicants were afforded protection of some kind – that is 40% of applicants.
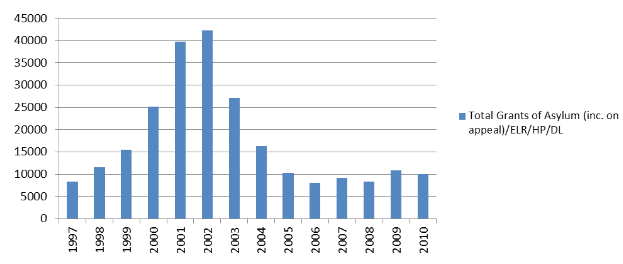
Figure 3. Total granted asylum, Exceptional Leave to Remain, Humanitarian Protection, Discretionary Leave or Appeal allowed 1997-2010
Total Asylum Refusals 1997-2010
8. Of the 660,000 cases decided, 243,000 were granted some form of protection (including appeals allowed) so 417,000 were refused and should have left, or been removed from the UK.
Removals 1997-2010
9. The majority of failed asylum seekers were not removed – just 36 percent of those who were denied asylum were removed. Across the whole period 151,540 principal asylum applicants were removed of whom 24,370 took part in an assisted voluntary return programme run by the International Organization for Migration and a further 8,615 were later established to have left the country without notifying the authorities. Thus, only 119,000 individuals were removed from the United Kingdom as a result of enforcement action by the UKBA across the 13 year period – on average less than 10,000 per year.
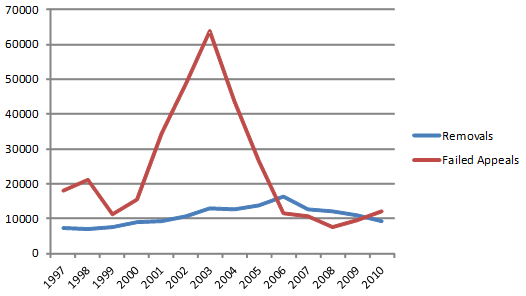
Figure 4. Number of failed appeals and number of removals 1997-2010
Asylum Applicants 1997 – 2010 still in the UK
10. The majority of failed asylum seekers neither go home nor are removed by the authorities. Of the 417,000 failed asylum seekers, 266,000 have neither left nor been removed and are therefore presumed to remain in the UK illegally. Therefore, of the 660,000 individuals who had decisions made between 1997 and 2010, 509,000 remain in the UK, or 77 percent – 243,000 legally and 266,000 illegally (although it is possible that some were granted ILR in connection with the “legacy” cases (see para 11 below).
Number of People Granted Leave under Backlog and Legacy Cases
11. As the asylum system continued to struggle, a body of cases accumulated which had not been concluded. This ‘legacy’ caseload consisted of cases where an application for asylum was made before March 2007 and the case had either not been resolved or action still needed to be taken to achieve a resolution. This included unprocessed cases, cases where a decision had yet to be made despite the application dating back many years, and cases of individuals who had been denied asylum but had not been removed. [6] The Home Office have now cleared this backlog. Of just over 400,000 cases, 40,500 have been put into a ‘controlled archive’ – these are cases where there is no indication that the individual has left the country however the UKBA is unable to locate them. The Home Office state that 38,000 have been removed and 161,000 have been granted settlement. An additional 165,000 or 41 percent of the total are characterised as ‘Other’. [7]
12. There were three earlier exercises of this nature. In 2003-6 the government granted indefinite leave to remain to just under 25,000 asylum claimants and 37,000 dependants in a “family ILR exercise” designed to clear the backlog of asylum claims from families who had applied before October 2000 and who had experienced delays in the system. These individuals would likely have had grounds for appeal against deportation under human rights legislation and so were granted indefinite leave to remain.[8] In 1999 and 2000, the government granted asylum to 29,000 asylum seekers and almost 8,000 dependants in a backlog clearance exercise.[9] In 1993/4, the government granted exceptional leave to remain to 32,000 failed asylum seekers.
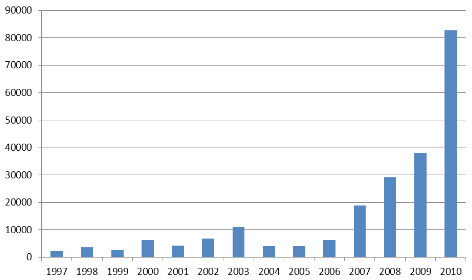
Figure 5. Other Grants of Leave on a Discretionary basis 1997-20010, which include grants of settlement aimed at clearing backlogs of asylum cases.[10]
Cohort Analysis 2004-2009
13. Analysis of the outcome of asylum applications on an annual basis is complicated by the fact that many decisions are reached after the year of initial application. To overcome this, the Home Office have undertaken cohort analysis to determine the outcome for each calendar year from 2004 to 2009. This analysis shows that 23 percent of those who claimed asylum in these years were recognised as a refugee either on initial decision or on appeal by the courts, and a further 10 percent were granted humanitarian protection or discretionary leave to remain in the UK. The majority of applicants were refused asylum – 62 percent. There is however a significant number of cases where the decision is unknown – 6 percent. Despite 62 percent of applicants being refused asylum, only 33 percent of these were removed. There are therefore approximately 64,000 (64,695) failed asylum seekers in the UK who applied for asylum between 2004 and 2009 alone. [11]
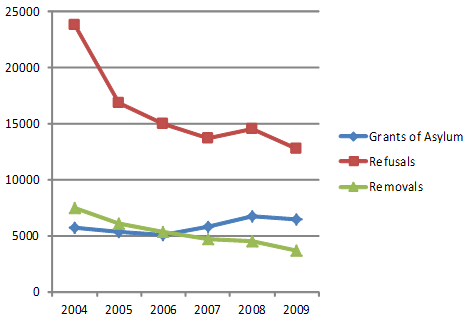
Figure 6. Cohort Analysis of Asylum Grants, Refusals and Removals from 2004-2009.
Timing of Applications 08-10
14. Figures recently released in response to a Parliamentary Question show that over the last three years the majority of those claiming asylum only do so once they have been discovered by the authorities. That 59 percent of applications were lodged once they had been detected suggests that seeking refuge was not their primary purpose for coming to the UK. It did, however, provide them with a means of continuing their stay while their case was being heard.[12]
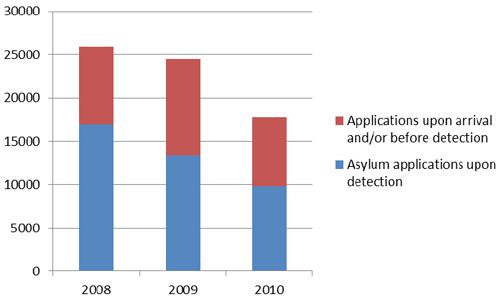
Figure 7. Breakdown of Asylum Applications 2008-2010 by time of application.
Asylum in the UK – the European Context
15. Eurostat data for 2009 published on 18 June 2010 suggests that in France, 14 percent of applicants were granted asylum or other forms of protection at the first instance compared to 27 percent in the UK.[13] The overall percentage of those granted protection, including on appeal, was 19 percent in France and 28 percent in Britain (although the Home Office cohort analysis suggests 33 percent).[14] These differences in the chances of being granted protection in the UK and France may be a contributing factor in the existence of makeshift refugee camps in the port regions of Northern France such as Sangatte - the infamous refugee camp on the edge of the site of the Channel Tunnel which the French authorities ordered to be closed down in 2002.
The cost of the Asylum system
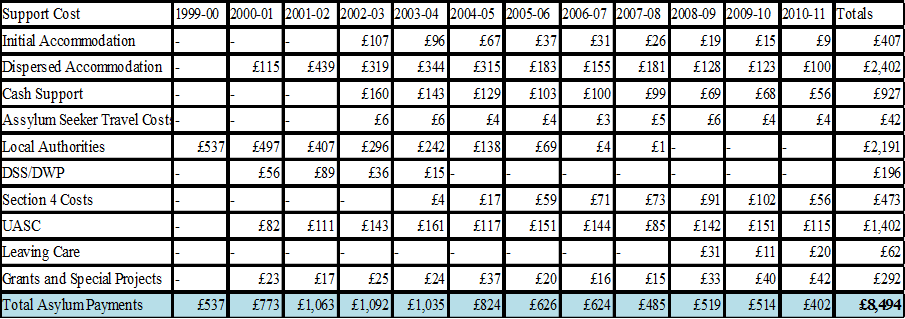
16. Since 1999, the Home Office has spent almost £8.5 billion in asylum support costs.[15] Home Office funding for the financial year 2010-11 totalled £402 million. Annex A details the costs to the Home Office since 1999. Some of these costs are explained in paragraphs 17 and 18.
17. Asylum seekers are housed while they await their decision. Temporary accommodation will be provided if they have nowhere to stay until more permanent accommodation can be found. Since 2000, the cost to the Home Office of accommodating asylum seekers comes to almost £2.8 billion.[16]
18. Asylum seekers are also entitled to cash payments to support themselves. These amounts take into account the fact that they do not have to pay rent or utilities and will be housed in a fully furnished property.[17] Since 1999 the Home Office has spent £927 million on cash support for asylum seekers awaiting decisions. Further to this is a provision for failed asylum seekers known as Section 4 support. Failed asylum seekers who are either unable to return home or are taking reasonable steps to leave the UK are entitled to support worth £35 per week which is in the form of a pre-paid payment card. Since 1999, the Home Office has spent almost £500 million on Section 4 Support.[18]
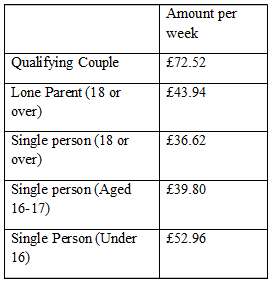
Figure 8. Cash support for asylum seekers awaiting decisions.[19]
Legal Costs
19. An applicant whose initial application for asylum has been rejected by the Home Office has the right to appeal that decision by taking his case to the First Tier Tribunal of the Immigration and Asylum Chamber. The immigration judge in the case will hear the evidence and either allow the appeal which effectively grants asylum to the applicant, or to dismiss the appeal and uphold the decision made by the Home Office. The costs of a hearing are dependent upon the complexity of each case, however, the average cost of a hearing in the financial year 2009-10 was £687.[20] Based on this figure, the cost of appeals in 2010 was £12.3 million (There were 17,930 appeals determined by the tribunals in 2010). The appeals system is complex and there are various stages, see Briefing Paper {89} for an explanation of the tribunal system and Briefing Paper {225} for information on the judicial review process.
20. There is currently before Parliament a Bill which has as its objective a considerable reduction in the categories of cases, including immigration and asylum cases, for which legal aid will in the future be available. In a recent response made by the Judges Council to the Legal Aid consultation, restrictions on the availability of legal aid for judicial reviews were suggested on the grounds that “Most claims fail, most of the claims that fail are without merit, and many are wholly abusive of the court’s process” and adding that money spent on judicial review is “largely wasted”.[21] As it stands immigration and asylum cases attract the right to legal aid. The legal aid bill for asylum and immigration cases is significant as the table below demonstrates.[22]
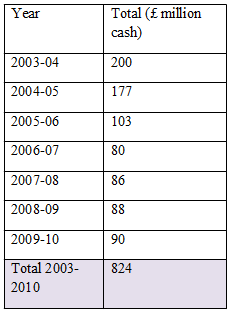
Figure 9. Cost of Legal Aid for Asylum and Immigration cases, 2003-2010.
21. These figures do not include the costs of running the immigration courts, nor the legal aid costs for the years 1999/ 2000 to 2002/3. The total cost of the asylum system from 1999 – 2010 must therefore be approaching £10 billion.
Annex A
(£ Millions)
Footnotes
- Asylum Statistics United Kingdom 1999, Table 1.1. URL: http://webarchive.nationalarchives.gov.uk/.../hosb1700.pdf.
- Asylum Statistics United Kingdom 1999, Table 1.1. URL: http://webarchive.nationalarchives.gov.uk/.../hosb1700.pdf
- Nicholas Soames, Parliamentary Question 54493, Hansard Reference: 10 May 2011, Column 1100W. URL: http://www.publications.parliament.uk/.../110510w0002.htm#11051093004830. From here on, all figures can be found here unless stated otherwise.
- 1991-1996 Figures can be found in Table 1.2 of Asylum Statistics 2000, URL: http://webarchive.nationalarchives.gov.uk/.../hosb1701.pdf, 1997-2010 Figures from Parliamentary Question 54493.
- 1991-2000 Figures can be found in Table 1.2 of Asylum Statistics UK 2000, URL: http://webarchive.nationalarchives.gov.uk/.../hosb1701.pdf, 2001-2008 Figures can be found in Table 2.2 of Control of Immigration Statistics 2009, URL: http://www.homeoffice.gov.uk/publications/.../hosb1510, 2009-2010 Figures can be found in Table 2.3 of Control of Immigration: Quarterly Statistical Main Tables, Quarter 4 2010, URL: http://www.homeoffice.gov.uk/publications/.../control-immigration-q4-2010.
- Melanie Gower, “Asylum ‘legacy’ cases”, House of Commons Research Briefing, August 2010. URL: http://www.parliament.uk/briefingpapers/.../snha-04439.pdf.
- Show -6 more...
- Asylum Statistics United Kingdom 1999, Table 1.1. URL: http://webarchive.nationalarchives.gov.uk/.../hosb1700.pdf.
- Asylum Statistics United Kingdom 1999, Table 1.1. URL: http://webarchive.nationalarchives.gov.uk/.../hosb1700.pdf
- Nicholas Soames, Parliamentary Question 54493, Hansard Reference: 10 May 2011, Column 1100W. URL: http://www.publications.parliament.uk/.../110510w0002.htm#11051093004830. From here on, all figures can be found here unless stated otherwise.
- 1991-1996 Figures can be found in Table 1.2 of Asylum Statistics 2000, URL: http://webarchive.nationalarchives.gov.uk/.../hosb1701.pdf, 1997-2010 Figures from Parliamentary Question 54493.
- 1991-2000 Figures can be found in Table 1.2 of Asylum Statistics UK 2000, URL: http://webarchive.nationalarchives.gov.uk/.../hosb1701.pdf, 2001-2008 Figures can be found in Table 2.2 of Control of Immigration Statistics 2009, URL: http://www.homeoffice.gov.uk/publications/.../hosb1510, 2009-2010 Figures can be found in Table 2.3 of Control of Immigration: Quarterly Statistical Main Tables, Quarter 4 2010, URL: http://www.homeoffice.gov.uk/publications/.../control-immigration-q4-2010.
- Melanie Gower, “Asylum ‘legacy’ cases”, House of Commons Research Briefing, August 2010. URL: http://www.parliament.uk/briefingpapers/.../snha-04439.pdf.
- Home Affairs Select Committee, 9th Report, The work of the UK Border Agency (November 2010 – March 2011), 2nd June 2011. Paragraph 3. URL: http://www.publications.parliament.uk/pa/.../92903.htm#a2.The category ‘Other’ includes errors and duplicates and people who are now EU citizens.
- James Clappison, Parliamentary Question 177410, Hansard Reference: 13 June 2008, Column 6MC. URL: http://www.publications.parliament.uk/pa/.../80613c0001.htm#column_6MC
- Douglas Carswell, Parliamentary Question 233650, Hansard Reference: 12 November 2008, Column 1214-1216W. URL: http://www.publications.parliament.uk/.../81112w0014.htm#08111242001492.
- 1997-1999 figures can be found in Table 5.3 of Control of Immigration Statistics 2006, URL: http://www.official-documents.gov.uk/.../7197.pdf, 2000-2006 figures can be found in Table 4.3 of Control of Immigration Statistics 2009, URL: http://www.homeoffice.gov.uk/publications/.../hosb1510, 2007-2010 figures can be found in Table 4.3 of Control of Immigration: Quarterly Statistical Main Tables, Quarter 4 2010, URL: http://www.homeoffice.gov.uk/.../control-immigration-q4-2010.
- Figures can be found in Table 2.7 of Control of Immigration Statistics 2009, URL: http://www.homeoffice.gov.uk/publications/.../hosb1510.
- Priti Patel, Parliamentary Question 38911, Hansard Reference: 9 February 2011, Column 334-5W. URL: http://www.publications.parliament.uk/.../110209w0005.htm#11020983000113.
- Eurostat, Asylum decisions in the EU27, URL: http://europa.eu/rapid/
- Eurostat News Release, EU Member States granted protection to 78,800 asylum seekers in 2009, URL: http://epp.eurostat.ec.europa.eu/cache/.../3-18062010-AP-EN.PDF
- Nicholas Soames, Parliamentary Question 60577, Hansard Reference: 20 June 2011, Column 4-6W. URL: http://www.publications.parliament.uk/pa/.../110620w0001.htm.
- Nicholas Soames, Parliamentary Question 60577, Hansard Reference: 20 June 2011, Column 4-6W. URL: http://www.publications.parliament.uk/pa/.../110620w0001.htm.
- URL: http://www.ukba.homeoffice.gov.uk/.../currentsupportamounts/
- Nicholas Soames, Parliamentary Question 60577, Hansard Reference: 20 June 2011, Column 4-6W. URL: http://www.publications.parliament.uk/pa/.../110620w0001.htm#1106207000492.
- UKBA, URL: http://www.ukba.homeoffice.gov.uk/.../currentsupportamounts/
- Gordon Banks, Parliamentary Question 51714, Hansard Reference: 26 April 2011, Column 151W. URL: http://www.publications.parliament.uk/pa/.../110426w0006.htm#11042749003992.
- Judges Council of England and Wales, Response to Sub-Committee of the Judge’s Council to the Government’s Consultation Paper CP12/10, Proposals for the reform of legal aid in England and Wales. Paragraph 17, page 4. URL: http://www.judiciary.gov.uk/.../response-judges-council-legal-aid-reform-consultation.pdf
- Nicholas Soames, Parliamentary Question 60579, Hansard Reference: 17 June 2011, Columns 1016W. URL: http://www.publications.parliament.uk/pa/.../110617w0002.htm. It is unfortunately not possible to disaggregate legal aid for asylum cases only.