Migration and Road Transport in England
18 May, 2011
Key Findings
- Population growth is a key factor along with GDP in driving traffic growth
- Congestion on the UK’s transport networks compares badly with networks elsewhere in Europe, and its road network in particular is regarded as being the most congested in the EU
- Recent estimates of the costs of road traffic congestion in the UK range up to £20 billion a year
- By far the worst road traffic congestion is in London, which is projected to receive by far the most immigrants over the next 25 years
- The population of the UK is projected to increase by around 10 million by 2033, and around 7 million of this is projected to be due to immigration. In England alone, population is projected to increase by around 9.3 million
- Traffic on England’s roads may increase by 28 billion vehicle kms over the next 25 years as a result of migration – 16 per cent of the total increase in forecast traffic
- Immigration will increase the number of potential drivers – those aged 17 or over – by some 4 million more people over the next 25 years
- Without action to mitigate it, the Eddington review of transport in the UK, published in 2006, estimated that congestion on England’s roads could cost an additional £23 – 24 billion each year by 2025
- Up to £5 billion of this could be due to the impact that immigration will have on traffic growth
- Based on the historical relationship between traffic growth and the size of the road network, around 5,900 kilometres of additional road will need to be built to 2035 as a result of traffic growth caused by net migration, and the cost of doing so will be around £17 billion in today's prices
1 Introduction and overview
1.1 Transport – mobility of people and goods – is a key human need and has been fundamental to social and economic development throughout history. Everybody is dependent, either directly or indirectly, on transport – to provide food and sustenance, to sustain and extend social relationships, to allow access to jobs, to trade in goods, to move the fuels needed for energy generation, to facilitate many leisure activities - to name but a few of the invaluable services that transport networks provide.
1.2 Transport is an essential input to modern economic development and performance. Canals, and later railways, facilitated the onset of industrialisation in Great Britain during the ‘Industrial Revolution’. In today’s economic environment, transport is crucial in enabling access to markets, connecting workers with their place of employment and suppliers with consumers. Access to good uncongested transport networks is widely regarded as critical for business success and there is long-standing concern in the UK that inadequacy of parts of its transport networks might have a negative impact on productivity and competitiveness. In a survey for the CBI in 2004, almost 70 per cent of senior business people considered that the UK’s transport system was ‘poor’ and retarding business performance.
1.3 Roads are by far the most important mode of transport and all journeys, whether predominantly by air, rail or sea, begin and end on the road network. Over 90 per cent of passenger transport is by road, over 80 per cent of inland freight carried in the UK is moved by road and 70 per cent of business and commuting trips take place by car. Road transport provides better flexibility in terms of timing and destination than the other transport modes and hence plays a key role in the domestic distribution of goods throughout the supply chain.
1.4 The road network of Great Britain is currently 394 467 kilometres long, approximately the same as the distance from the Earth to the Moon
2 Relationship between road transport and population growth
2.1 The demand for transport is influenced by a number of factors, of which population and economic growth (GDP) are the most important.
2.2 Since the early 1950s, passenger transport in Great Britain, across all transport modes, has increased almost fourfold – the vast proportion of this due to increased car traffic, the relationship of which with population change in the UK has varied widely.
In the 1950s, for example, car traffic increased by over 40 per cent, or almost ten times as fast as population, as car ownership began to take off. In the ten years from the mid-1990s, however, the rate of increase of car traffic had fallen to just over double that of the population.
3 Population projections and impact of migration on population growth
3.1 There is insufficient data about the specific travelling patterns of migrants to provide input into an econometric model of transport demand. Hence, an alternative approach, utilising knowledge of the relationship between traffic growth and population growth, the contribution of immigration to population growth, the relationship between traffic growth and congestion, and the travelling patterns of existing ethnic minorities in the UK, is taken in this paper.
3.2 In its Principal Population Projection for 2008, the ONS projected a total population increase in the UK between 2008 and 2033 of 10.2 million (with 9.3 million of this being in England). 7 million – or 67 per cent – of the increase in the UK is projected to be due to net international migration over this period. The table below shows the projected population change in England for this period and the contribution of net migration to this, broken down into net migrants and the impact that migration has on the difference between births and deaths – ‘natural change’.
Table 1: ONS Population Projection for England 2008 - 2033
Total Population Increase |
9 255 000 |
|
of which: Due to Assumed Immigration |
3 995 000 |
43 per cent |
of which: Due to ‘Natural Change’ from the assumed level of Net Migration |
2 252 000 |
24 per cent |
Source: ONS
3.3 A breakdown (Table 2) of the total of projected net migration in England over this period by Government Region shows that over a third of it will occur in London, the region of England with the worst congestion (Table 3):
Table 2: Regional Breakdown of Net Immigration, 2008 – 2033
Region |
Projected Net Immigration |
Percentage of Total |
North East |
149 000 |
3.5 |
North West |
90 000 |
2.1 |
Yorkshire & Humber |
625 400 |
14.5 |
East Midlands |
347 900 |
8.1 |
West Midlands |
291 100 |
6.8 |
East of England |
564 400 |
13.1 |
London |
1 569 000 |
36.5 |
South East |
515 100 |
12.0 |
South West |
176 100 |
4.1 |
ENGLAND |
4 300 000 |
100 |
Source: ONS – Sub-National Population Projection
3.4 It should be noted that the figure of 4.3 million for projected net immigration into England is slightly different from the figure in Table 1 because it includes net migration into England from the other constituent countries of the UK.
Table 3: Regional Breakdown of Congestion
Region |
Average vehicle speeds (km/hr) during weekday morning peak on locally managed ‘A’ roads |
North East |
28.4 |
North West |
22.6 |
Yorkshire & Humber |
25.1 |
East Midlands |
28.9 |
West Midlands |
25.7 |
East of England |
30.1 |
London |
16.5 |
South East |
27.3 |
South West |
28.7 |
ENGLAND |
25 |
Source: Department for Transport (DfT)
4 Congestion
4.1 Congestion occurs when the number of vehicles on a road network exceeds its capacity, disrupting the smooth flow of traffic. It is manifested with slower traffic speeds, longer journey times and increased vehicle queueing. Excess road use in relation to the capacity of roads to carry the traffic on them is the most common cause of congestion, although there are other factors which cause congestion – such as: adverse weather, road works, vehicle breakdowns and accidents.
4.2 The UK is widely considered to have the most congested transport networks in Europe, according to the Government’s former transport advisers, the Commission for Integrated Transport (CfIT) :
“The latest research on national transport networks across Europe, published by CfIT in November 2001, shows that the UK is the most congested country in Europe”[1]
4.3 In London, CfIT surveyed public opinion which showed that traffic congestion in the capital was regarded as being a bigger problem than crime.[2]
4.4 Subsequent research by other bodies has confirmed the CfIT’s findings. A survey in 2010 by Inrix – a traffic management company – found that drivers in the UK spent more time in traffic than those in Belgium, France, Germany, Luxembourg and the Netherlands. In addition, London is second only to Paris as the most congested city in the six countries analysed.
4.5 According to Inrix’s findings, on average, a journey along the UK’s major motorways during peak weekday driving hours takes 22% longer than the same journey would take in uncongested conditions..
4.6 The UK’s trunk road system, based around its motorways, is small relative to the volume of traffic that it has to carry. A key factor explaining this congestion has been the historic low levels of investment in transport infrastructure in the UK, but population growth is also of increasing significance.
5 Current Costs of Congestion
5.1 Congestion, by delaying journeys and increasing unreliability of journey time, wastes time which could otherwise be put to productive use, and this forms the basis of calculations of its cost. Estimates of the cost of road transport congestion – based on valuing the additional journey time necessitated by congestion - are very big in monetary terms: the Cabinet Office, in a report published in 2009, estimated that the ‘excess cost’ of congestion in urban areas was around £11 billion each year. For the country as a whole, the CBI some years ago estimated road congestion as costing about £20 billion a year.[4] Another estimate by the British Chambers of Commerce in 2007 [5] has put the cost of congestion at around £18 billion. These estimates are conservative because they exclude reliability impacts, wider economic impacts and do not take into account higher values of time in London and South East England.[6] They are also all based on historic prices and do not take into account recent inflation.
5.2 In addition to the monetary cost of delays, congestion also has a negative impact on vehicle emissions because of the lower operating efficiency of vehicle engines in such conditions, and hence is a cause of atmospheric pollution and climate change. Environmental impacts have their own economic costs, as the Stern Review on the Economics of Climate Change demonstrated in 2006.
6 Government Traffic Forecasts to 20356.1 The most recent (2009) road traffic forecast for England by the Department for Transport (DfT) is summarized in Table 4:
Table 4: ‘Central’ Forecast: Change (%) Compared with 2003 Baseline
|
Traffic |
Congestion (lost time/km) |
2015 |
7 |
6 |
2025 |
25 |
27 |
2035 |
43 |
54 |
Source: DfT
6.2 Congestion is measured in several ways, and in the DfT’s forecast, congestion is measured as seconds lost per vehicle kilometres relative to the speeds that would be expected if the network was uncongested . The increase of 54 per cent in congestion across the English road network as a whole represents an average increase in time spent of 9 per cent (6 seconds) for each km travelled. The biggest impact of traffic
growth on congestion is forecast to be in London, where over 40 per cent of traffic by 2035 is forecast to travel in ‘very congested conditions’.
6.3 Vehicle traffic on England’s roads, according to DfT’s forecasts, will increase to over 600 billion veh/kms by 2035 – an increase of over 180 billion veh/kms compared to 2003 levels (422 bn veh/kms) and 170 billion veh/kms compared with 2008 levels (436 bn veh kms). Population and economic growth (GDP) together explain most of the forecast growth in traffic and congestion, with around 40 per cent of the increase in traffic being due to population growth alone.[7] Hence, an increase of around 70 billion veh/kms (170 multiplied by 0.42) in traffic will be due to the projected increase in the population of England. To calculate the potential contribution of net migration to this we need to take into account the following variables[8]:
- The increase in the population of England due to immigration between 2008 and 2033, based on the Government’s ‘Principal Population Projection’.
- The number of net migrants over this period eligible by reason of their age to drive
- The contribution of ‘natural change’ – the excess of births over deaths – induced by net migration to the numbers of people eligible to drive, and
- The propensity of migrants to travel
6.4 Taking the first of these: the population of England is projected by the Government to grow by 9.3 million between 2008 and 2033, and over this period, net migration will add 4 million to this (43 per cent), as shown in Table 1. Of this number, 90 per cent (or 3.6 million) are assumed to be aged 17 or over, in line with the tendency of most migrants to be concentrated in the young adult age range.
6.5 To estimate the likely impact that natural change caused by immigration may have on numbers of drivers the calculation is more complex It is possible to calculate the impact that natural change caused by net immigration will have on population growth by subtracting the estimate for natural change in the ONS’s Zero Net Migration
Projection from that in its Principal Population Projection. This gives a figure of 2.3 million, as in Table 1. Only a small proportion of this – 15 per cent, or around 340,000 – will occur in the period between 2008 and 2016 – the latter being the last year that people born then can gain a driving licence by 2033 and hence potentially contribute to traffic growth in this period.
6.6 The sum of the two variables – the eligibility to drive of net migrants (3.6 m) and
net births due to natural change caused by immigration (0.34 m) – provides an estimate of the number of migrants potentially adding to traffic growth over this period. Thus immigration will add nearly 4 million to the number of potential drivers in the next 25 years, which is approximately 50 per cent of the total population increase aged 17 and over in England. This provides a crude estimate of the contribution of immigration to traffic growth in England, which is 35 billion vehicle kms – 70 multiplied by 0.5.
6.7 Migrants will probably have a lower propensity to travel for various reasons, such as lower car ownership rates, ability to drive and employment, and may make shorter trips because they tend to live disproportionately in urban areas. There is no data on the specific transport patterns of migrants but virtually all net migrants will be from BME communities. Ethnic minorities in the UK make about 20 per cent fewer trips than ‘whites’ and ‘black’ (but not ‘Asian’) households are less likely to be car owners (DfT - National Travel Survey, 2009). Taking these factors into consideration, the estimate of 35 billion vehicle kms is reduced by some 20 per cent to yield a figure of around 28 billion vehicle kms.
7 Projected Costs of Congestion to 2025
7.1 This section considers only the period up to 2025 which is that covered by the Eddington Transport Study. That report projected under its ‘central scenario’ that by 2025 about one-third of traffic in London and one- fifth of traffic in other urban areas would be travelling on ‘very congested roads’. Additionally, parts of the inter-urban trunk road network would suffer an increase in congestion of about 37 per cent over the same period. In England as a whole, the total additional cost each year of congestion to road users would rise by some £23 – 24 billion by 2025 compared with 2003. How much of this may be due to net migration over this period?
7.2 Between 2008 and 2025, the population of England is projected to grow by 6.5 million and some 2.9 million of this will be due to net immigration, of which some 2.6 million – or 90 per cent – are assumed to be eligible to drive, which is 40 per cent of the total increase in population. The impact on congestion is found by the following calculation which assumes that one of the factors driving the increase in congestion is the same as that influencing traffic growth – population growth. The increase in the cost of congestion in 2025 caused by population growth alone is £10 billion – 42 per cent of £24 billion. Since immigration accounts for 50 % of the additional potential drivers (para 6.6 above), the increase in the cost of congestion likely to be caused by net migration in this period is half of £10 billion or £5 billion.
7.3 This is not (unlike the projection of traffic growth caused by migration) reduced by 20 per cent to reflect the likely lower propensity of migrants to own cars and to travel, because offsetting this, however, is the fact that migrants are disproportionately concentrated in areas that already experience the highest levels of congestion, especially London, which – given the non-linearity of the relationship between transport demand and congestion – will result in a disproportionate increase in congestion.[9] This is in line with the finding of the Government’s Migration Advisory Committee which noted in its recent report on ‘Limits on Migration’ that:“[Tier 1 & 2] migrants, as members of the UK population, will contribute to total congestion. They are likely to generate more congestion than the average UK-born individual, reflecting the fact that they are more likely to be employed and more likely to work in London.”
7.4 In our calculation, these two effects – the lower propensity of migrants to travel and their disproportionate concentration in areas of high congestion - are assumed to cancel each other out.
7.5 It should be noted that the cost of congestion calculated is the additional cost over the period to 2025 compared with 2008, does not incorporate existing congestion cost and does not incorporate the impact on congestion of migrants who settled in England prior to 2008.
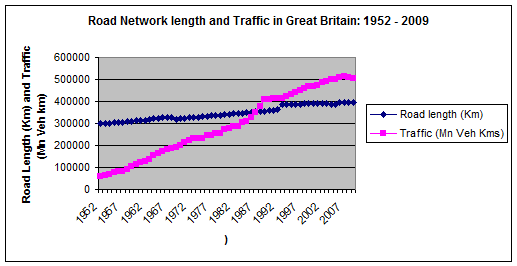
8.1 Over almost six decades – between 1952 and 2009 – road traffic in Great Britain grew over eight-fold – from 61 billion (bn) vehicle kms (vk) in 1952 to 504 bn vk in 2009. Over the same period, the total length of all roads in Great Britain increased by just under 100,000 km, or around 1,700 km a year on average. Most additional roads built were to provide access to housing developments.
8.2 In future, the scope for significant expansion in the size of the UK’s trunk road network is limited and the Road Programme nowadays is mostly concerned with upgrading existing stretches of road, rather than building new ones. For example, a major part of today’s road programme is converting the hard shoulders of motorways into additional lanes. In any case, the roads programme only refers to roads which are motorways and trunk roads and part of the network controlled by the Highways Agency, whilst the additional road length we project as needed is almost exclusively roads serving new housing.
8.3 The chart below shows the relationship between the length of the British road network and the traffic it carries. Every 1 billion increase in vehicle kms – road traffic – is associated with an increase in the length of the road network of 212 km. This provides an indication of the order of magnitude of the additional road capacity required. In line with our estimate that net migration will increase road traffic by around 28 billion vehicle kms by 2035, on past patterns, this translates into an increase of road length of around 5,900 km . Virtually all these roads will be linked with housing developments.
8.4 Using pricing data for civil engineering construction taken from Spons,[10] the financial cost of building these roads will be very considerable –Around £17 billion in today's prices.
Figure 1: Road Network Size and Growth in Traffic in Great Britain
The key assumptions used in this paper, together with their value and source, are set out in the table below:
Assumption |
Value |
Source |
Age profile of immigrants |
90 % aged 17 or over |
ONS –Population Projection, 2008 |
Construction cost of urban roads |
Average of range of £2650 to £3120 for one metre of road |
Spons – Civil Engineering & Highways Works Price Book |
Lower propensity of BME population to travel |
20 % fewer journeys than ‘whites’ |
DfT – National Travel Survey, 2009 |
Relationship between population growth and traffic growth |
42 % of traffic growth is caused by population increase |
DfT – Research Annex to Eddington Transport Study, 2006 |
Relationship between traffic growth and congestion |
Non-linearity – the higher is existing congestion, the bigger is the proportionate impact of traffic growth on subsequent congestion |
Migration Advisory Committee – Limits on Migration, 2010 |
Relationship between traffic growth and road network size |
Every 1 bn increase in vehicle traffic (vehicle/ kms) is associated with an increase in road network length of 212 km |
Regression, based on data in Transport Statistics – Great Britain, 2010 |
10 Sources of Data
DfT Traffic Forecasts:
http://www.dft.gov.uk/pgr/economics/ntm/forecasts2009/
DfT National Travel Survey 2009
http://www.dft.gov.uk/pgr/statistics/datatablespublications/nts/
Eddington Transport Study:
http://webarchive.nationalarchives.gov.uk/+/http:/www.dft.gov.uk/about/strategy/transportstrategy/eddingtonstudy/
Migration Advisory Committee:
http://www.ukba.homeoffice.gov.uk/sitecontent/documents/aboutus/workingwithus/mac/mac-limits-t1-t2/report.pdf?view=Binary
ONS Population Projection:
http://www.statistics.gov.uk/cci/nugget.asp?id=1352
RAC Foundation Report – ‘Roads and Reality’:
http://www.racfoundation.org/research/economics/Roads-and-Reality.
Road Congestion:
http://www.whatcar.com/car-news/uk-s-traffic-is-worst-in-europe/253848
http://webarchive.nationalarchives.gov.uk/+/http:/www.cabinetoffice.gov.uk/strategy/work_areas/urban-transport.aspx
Road Users Alliance:
http://www.rua.org.uk/RoadFile_2010-11.pdf
Stern Review – The Economics of Climate Change
http://webarchive.nationalarchives.gov.uk/+/http:/www.hm-treasury.gov.uk/independent_reviews/stern_review_economics_climate_change/stern_review_report.cfm
Footnotes
- http://cfit.independent.gov.uk/pubs/2002/pfru/research/pdf/pfru-tech.pdf
- http://cfit.independent.gov.uk/pn/010718/02.htm
- Cabinet Office: The Wider Costs of Transport in English Urban Areas (2009)
- Referenced in House of Commons Transport Committee – Seventh Report: Road Pricing – The Next Steps (2005)
- The British Chambers of Commerce – Business Travel: Choice or Necessity? (2007)
- : The Eddington Transport Study: The Case for Action – December 2006
- Show -6 more...
- http://cfit.independent.gov.uk/pubs/2002/pfru/research/pdf/pfru-tech.pdf
- http://cfit.independent.gov.uk/pn/010718/02.htm
- Cabinet Office: The Wider Costs of Transport in English Urban Areas (2009)
- Referenced in House of Commons Transport Committee – Seventh Report: Road Pricing – The Next Steps (2005)
- The British Chambers of Commerce – Business Travel: Choice or Necessity? (2007)
- : The Eddington Transport Study: The Case for Action – December 2006
- DfT – Transport Demand to 2025 & the Economic Case for Road Pricing and Investment – research annex to vol 3 of the Eddington Study ; Roads and Reality – Banks, Bayliss, Glaister – RAC Foundation 2007
- DfT’s traffic forecast compares traffic in 2035 with levels in 2003. – the baseline. The baseline used in this calculation is 2008 and the projection ends in 2033, in line with ONS’s population projections.
- Migration Advisory Capacity: Limits on Migration – November 2010
- Spons – Civil Engineering & Highways Works Price Book