Changing Primary Schools in England: 1998 - 2010
22 November, 2010
Summary
1. This paper examines the impact that immigration, much of it from non English speaking countries, has had on our primary schools in the period 1998 to 2010.
2. It examines England as a whole, individual regions, and three groups of Local Education Authorities (LEAs) - London Boroughs, the largest urban boroughs outside London, and the remaining LEAs in England. It also projects the numbers to 2018.
3. The following are the main findings:
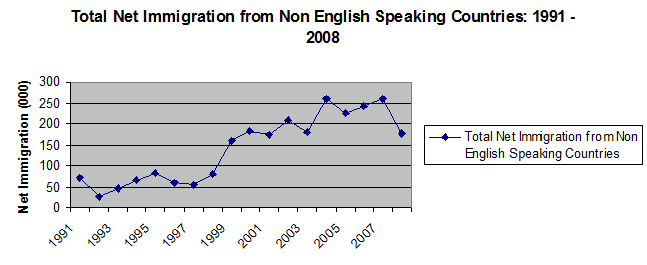
a) In total, between 1991 and 2008, there was a net increase of over 2.5 million in long-term immigrants arriving in the UK from non English speaking countries, mostly to settle. There was a net inflow of 2 million of them between 1998 and 2008.
b) The effect has been intensified by the rapid increase in the number of foreign born women of reproductive age. In 2007 this total was nearly 43% higher than in 2001. In contrast, the number of UK born woman of reproductive age was nearly 3% lower in the same period.
c) In the period 1994 to 2009 the proportion of births to foreign born women rose from 14% to 25%.
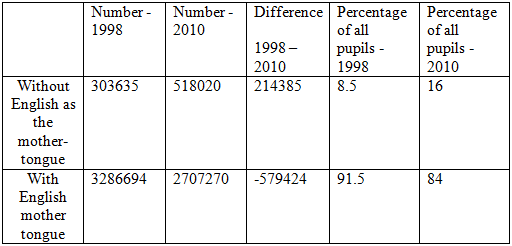
d) In the period 1998 to 2010, the proportion of children in primary schools in England for whom English was not the mother tongue nearly doubled to 16%, or over half a million out of 3.2 million children.
e) In inner London in 2010 55% of all primary school pupils did not have English as their first language.
f) In outer London the proportion of pupils without English as a mother tongue almost doubled from 22% to 39%.
g) In six out of the nine regions and in England as a whole, the percentage of children without English as a mother tongue almost doubled from 8.5% to 16%.
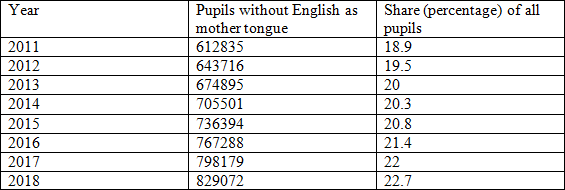
h) Our projection suggests that the percentage of primary school children in England without English as a mother tongue will increase to 22.7% in 2018, or almost 830,000 - a 60% increase on current numbers.
Introduction
4. Net immigration into the UK from overseas increased very significantly with the election of the Labour Government in May 1997. In the seven years from 1991 to 1997, it averaged around 41,000 each year; thereafter, in the eleven years to 2008 it averaged around 180,000.
5. Most of this net immigration came from countries where the predominant language is other than English – the European Union (excluding the Irish Republic), ‘New Commonwealth’ countries in Africa and Asia, and other countries outside Europe with few historical or cultural links to the UK – for example, the Democratic Republic of Congo. In the seven years from 1991 to 1997 such net immigration averaged almost 60,000 each year, but in 1998 and thereafter it increased over threefold, averaging almost 200,000 each year to 2008. In total, between 1991 and 2008, there was a net increase of over 2.5 million long term immigrants from non – English speaking countries arriving in the UK, mostly to settle. Figure 1 below shows the approximate trend of net migration from Non-English Speaking Countries between 1991 and 2008.
Figure 1: Trend of Immigration from Non-English Speaking Countries (NESC)
Sources of Immigration
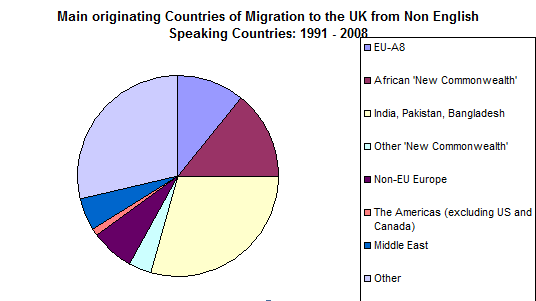
6. Figure 2 below shows the main country groupings from which immigration originated, with over half of net migration accounted for by three areas – EU – A8 (countries like Poland which acceded to the EU in 2004), ‘New Commonwealth’ countries in Africa, and the Indian Sub-Continent countries.
Figure 2: Sources of Net Immigration to the UK from NESC
Impact on Births
7. As well as increasing the UK’s population directly, this migration also had an indirect impact, because of the migration of women of child-bearing age into the UK: by 2007 the number of foreign born women of reproductive age was nearly 43 per cent higher than in 2001. In contrast, the number of UK born women of reproductive age was nearly 3 per cent lower in 2007.
8. Because numbers of UK born women of reproductive age declined for much of this period whilst numbers of women born outside the UK increased, there was a significant and continuing shift in the composition of births: births to UK born women fell in practically every year over the period from 1998, and in 2009 births to women born in the UK were over 17,000 fewer than in 1998. However, over the same period, births in the UK to women who were themselves born outside the UK increased consistently over this period, more than doubling, so that there was a very significant rise in the proportion of total births to such women – in 1994, they accounted for 14 per cent of such births, and by 2009 this share had grown to over 25%. Overall, two thirds of the increase in births since 2001 can be attributed to foreign born women. 1
Impact on Primary Schools in England
9. One of the consequences of a rapid and continuing growth in births to women who had immigrated from non-English speaking countries to the UK, and a falling birth rate amongst UK-born women was to change the ethnic and cultural composition of school populations, vastly increasing the range of languages spoken by pupils and the numbers without English as their mother-tongue. In 2005 it has been estimated that in England, in both primary and secondary schools, at least 702,000 pupils spoke at least 300 different languages 2.
10. The table below illustrates the changing linguistic composition of primary school pupils – defined by whether or not the mother tongue is English - Proportions have nearly doubled to 16% or over half a million out of 3.2 million.
Table 2: Changing Linguistic Heritage of Primary School Pupils in England
English Regions
11. Statistics about the changing composition of primary school pupils by Government Region in England are set out in Table 3:
Table 3: Changing Linguistic Heritage by Government Region
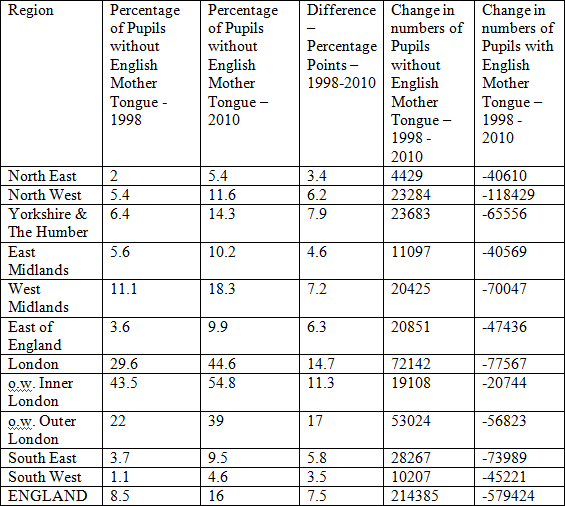
Inspection of this table reveals the following - between 1998 and 2010:
- The percentage proportion of primary school pupils without English as Mother Tongue (EMT) more than doubled in six out of the nine regions and in England as a whole it almost doubled
- The biggest proportionate change – measured by percentage points difference – was in London, especially the Outer London boroughs, although in Inner London in 2010 over half of all primary school pupils did not have English as their first language
- The increase in Outer London was over double the increase in Yorkshire and the Humber – which recorded the biggest increase outside London
- In every Region, absolute numbers of children without EMT increased, with numbers of children with EMT experiencing a much bigger decline
- The total across all Regions of numbers of pupils with EMT fell by almost 600,000, whilst numbers of pupils without EMT increased by almost 215,000 – with London alone accounting for a third of this increase.
Data for Local Education Authorities (LEA)
12. Tables 4 to 6 present data for three groups of LEA: London Boroughs, the largest LEAs in built-up areas outside London, and remaining LEAs in England.
- The data for London (Table 4) shows that although in most Inner London Boroughs the proportion of pupils without an English mother tongue is generally higher than in Outer London, the increase in Outer London Boroughs was higher: out of 19 boroughs, only four (Bexley, Bromley, Havering, Richmond) had a percentage points increase in single figures. By far the biggest increase was in Barking, registering an increase of over 34 percentage points. Other Boroughs registering big increases in shares were Redbridge (23.1 percentage points) and Hillingdon (23.3).
- A particularly striking feature of London Boroughs is the high rate of increase of non-English mother tongue recorded for most Boroughs: in 23 out of the 32 Boroughs in the table, the proportionate increase was over 10 percentage points. In the rest of England, only 15 (out of 98 LEAs) recorded a similar rate of increase.
- For LEAs in the biggest built-up areas outside London (Table 5), three (Birmingham, Bradford, Leicester – with a combined population of over 1.8 million) had shares of pupils without English mother-tongue in excess of 40 per cent in 2010, and a further seven had shares more than 20 per cent. In over a third of these LEAs the increase in percentage points was in double figures. In all but one of the LEAs (Bradford) numbers of pupils with English mother tongue fell.
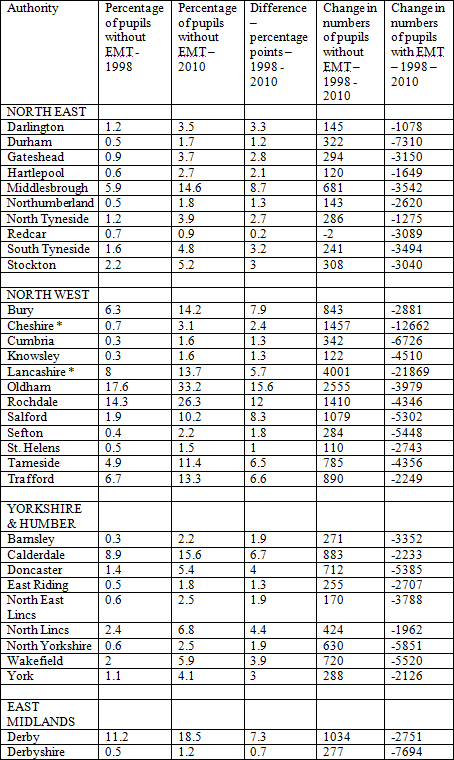
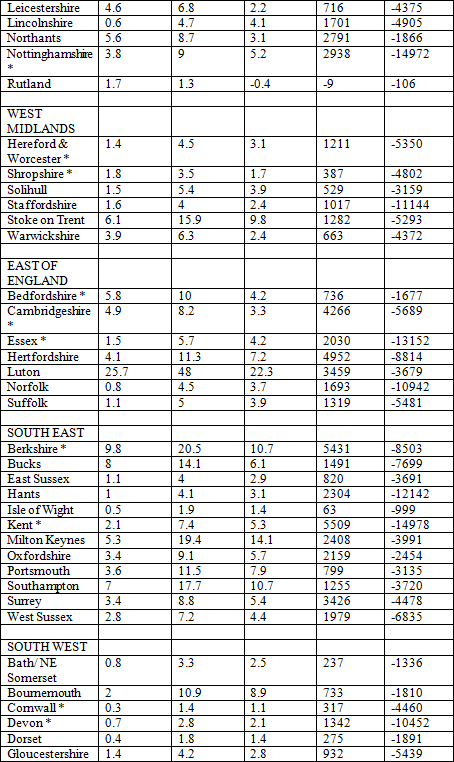
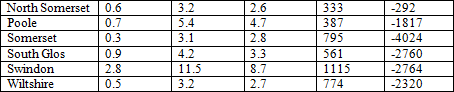
- In the rest of the LEAs, a much lower proportion show significant shares of non-English mother tongue pupils or record big percentage point increases. Only in four is the percentage share in 2010 in excess of 20 per cent, and only in six (‘Berkshire’, Luton, Milton Keynes, Oldham, Rochdale, Southampton) is the increase greater than 10 percentage points . Reflecting its recent intense immigration trends, Luton records the biggest increase in such pupil shares outside London (22.3 percentage points) and, with almost half of all pupils without English mother tongue in 2010, it is eclipsed only by Slough (where the share of such pupils is 55.6 per cent) as the LEA outside London with the biggest proportion of such pupils.
Table 4: London Boroughs
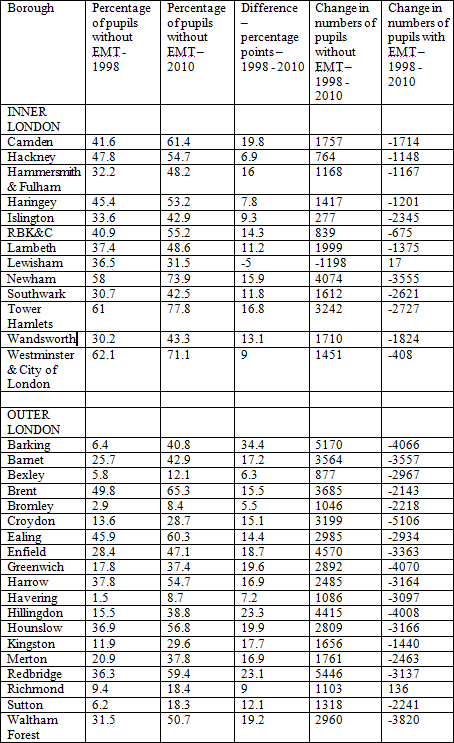
Table 5: Major LEAs in Built-Up Areas Outside London
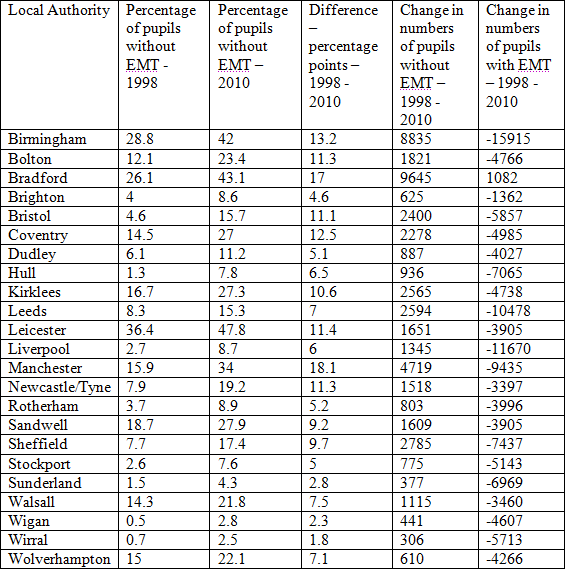
Table 6 .Other Local Education Authorities
Projected Numbers to 2018
13. Table 7 below is a projection of numbers of pupils without English mother tongue in English primary schools to 2018, when such pupils – who currently comprise almost 1 in every 6 primary school children – would comprise over 1 in every 5. This increase is driven by the assumption that births in the UK to foreign-born women, which have increased consistently every year since 1998, would continue to increase in the period 2010 – 2013, in which latter year children born would start school in 2018.
Conclusion:
14. Immigration from non English speaking countries has already had a massive impact on our primary schools, especially in urban areas. Continued high levels of immigration will accelerate these changes both directly and indirectly as a result of higher birth rates among many first generation immigrants.
Annex A
Methodology
The calculation of numbers of net migrants from ‘Non-English Speaking Countries’ (NESC) in Figs. 1 & 2 is based on data from ONS’s ‘Long Term International Migration’ database. It is an approximate estimate only because published data on country of origin of migrants does not identify some specific countries where migration flows are significant – for example, Republic of Ireland (for this reason, only migration flows from the ‘A8’ countries are included, rather than the whole of the EU which would include Ireland). The small number of migrants from the Americas, excluding the USA and Canada, would also include immigrants from the English-speaking Caribbean, but such flows have been very small in recent years.
Direct comparison between some LEAs in 1998 and 2010 is not possible for 22 LEAs which were newly created out of ‘Shire Counties’ since 1998. In these cases, they have been added to the former County Councils from which they were separated to provide a basis for comparison - (they are indicated with an asterisk - * - in the tables). For example, Berkshire as an LEA (and County Council) no longer exists, so the data for ‘Berkshire’ in 2010 is derived from that for the LEAs which replaced it – Bracknell Forest, Reading, Slough, West Berkshire, Windsor & Maidenhead, Wokingham.
Projections of pupil numbers without English as a mother tongue to 2018 are calculated by regressing such numbers of pupils over the period 2003 – 2010 against births in England and Wales to foreign-born women between 1998 and 2005, and then using the linear relationship to estimate pupil numbers between 2011 and 2018. The share of such pupils in total primary school rolls in England is calculated using official projections of primary school pupil numbers.
Annex B
Sources of Data
Data on international migration into the UK:
http://www.statistics.gov.uk/statbase/Product.asp?vlnk=507
Data on births:
http://www.statistics.gov.uk/statbase/Product.asp?vlnk=14408
Interpretation of recent trends in births in the UK:
http://www.statistics.gov.uk/articles/population_trends/PT136FertilityArticle.pdf
Languages spoken in schools in England:
http://www.cilt.org.uk/home/research_and_statistics/language_trends/community_languages.aspx
Pupil data for 1998:
Department for Education & Employment: Statistics of Education – Schools in England, 1998 (TSO)
Pupil data for 2010:
http://www.education.gov.uk/rsgateway/DB/SFR/s000925/index.shtml
Pupil number projections to 2018:
http://www.education.gov.uk/rsgateway/DB/STR/d000921/index.shtml
Footnotes
- ‘Have women born outside the UK driven the rise in UK births since 2001’? – ONS, Population Trends – 136 Summer 2009
- CILT : Language Trends, 2005
- ‘Have women born outside the UK driven the rise in UK births since 2001’? – ONS, Population Trends – 136 Summer 2009
- CILT : Language Trends, 2005