Migration Watch UK
International Migration Statistics
21 December, 2006
Summary1. Immigration from Eastern Europe in 2005 accounted for only one in five foreign immigrants; the rest were mainly from Asia and Africa.
2. It is likely that East European immigrants were undercounted at 65,000 – a figure which implies that only one in four East Europeans have stayed for more than a year. However, even if the true figure was twice this, they would still be only 40% of net foreign immigration. Net immigration from the EU 15 in 2005 was only 25,000.
3. This pattern demonstrates that the tripling of immigration in the past ten years has largely resulted from “managed migration” routes. It also underscores the need for firm action to limit immigration from non- EU countries which are the main source of net foreign immigration.
Detail
4. The latest set of international migration statistics, covering calendar 2005, were released by the Office for National Statistics on 2 November.
5. They showed that there was overall net migration to the UK (i.e. an excess of immigrants over emigrants) of 185,000. This was a reduction of 37,000 in comparison with 2004 but still the second highest level of net immigration on record.
6. The 185,000 was made up of a net inflow of 292,000 foreign citizens and a net outflow of 107,000 British citizens.
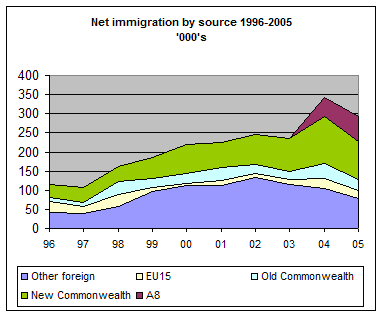
7. The following graph shows the net inflows of foreign citizens over the ten year period 1996-2005 by broad citizenship:
Notes:
A8 refers to the 8 countries (excluding Cyprus and Malta) which acceded to the EU in 2004. Immigrants from these countries would have been included in ‘other foreign’ totals before 2004. EU15 refers to the 15 countries which were members of the EU prior to 2004 (but excluding British citizens) Old Commonwealth is Australia, New Zealand, South Africa and Canada Malta and Cyprus are included in the New Commonwealth totals throughout.
8. As can be seen net foreign immigration has tripled over the last 10 years from levels of just over 100,000 a year to a peak of 342,000 in 2004 falling back just slightly to 292,000 in 2005.
9. In the middle years of the decade, between a quarter and a third of this was due to asylum claims. The ONS make an adjustment each year for new asylum claimants and their dependants less those who have been removed from the country. The following chart shows the ONS’s adjustment for asylum seekers and the net number of immigrants, excluding asylum seekers.
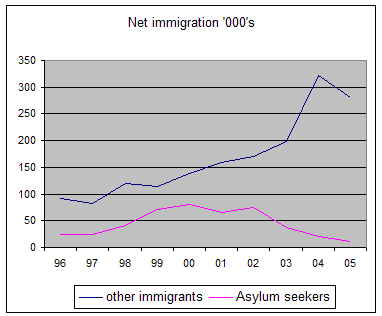
10. These graphs clearly demonstrate that the rise in immigration over the last 10 years has resulted from so-called managed migration routes, principally work-related migration and migration for family formation/family reunion purposes.
11. The upwards trend in non-asylum immigration has clearly been accentuated in the last two years by immigration from the Eastern European (A8) countries which joined the EU in May 2004. However, net foreign immigration excluding the A8 countries was still 227,000 in 2005. In the same year the ONS statistics show net immigration from the A8 countries was just 65,000. Net immigration from these countries therefore made up just over 1 in 5 (22%) of total net foreign immigration.
12. However, ONS statistics for net immigration from the A8 countries should be treated with some caution. Data from the workers registration scheme, set up by the government to manage access to benefits of employed workers from the A8 countries, show that a total of 447,000 workers from the A8 countries registered between 1 May 2004 and 30 June 2006. Self-employed workers do not have to register and some migrants from the A8 countries will be working without their employer registering them. Independent surveys would suggest that when these migrants are included it will increase the total number of migrants from the A8 countries by over 30% to 600,000 – a figure also mentioned by a Home Office Minister.
13. The number of workers who registered in 2005 was 204,905. This would point to a total inflow of about 260,000 A8 migrants in 2005 if self-employed and unregistered workers are included. Dependants are additional to these numbers and they would probably bring the total number of A8 migrants in 2005 up to 280,000.
14. By comparison, the international migration statistics show a net migration figure of just 65,000 for 2005 made up of an inflow of 80,000 immigrants and an outflow of 15,000 emigrants. The statistics record migrants who are entering/leaving the UK with the intention of staying for at least a year. The ONS figure of 80,000 immigrants would therefore suggest that only about 1 in 4 A8 immigrants enter the UK with the intention of staying here a year or more.
15. The Governor of the Bank of England, Mervyn King, has recently criticised the reliability of the international migration data. He suggests that it may be particularly unreliable for Eastern European migrants because the survey on which the data is based, the International Passenger Survey (IPS), concentrates on the three main international ports of entry - Heathrow, Gatwick and Manchester. Only 79 passenger interviews were conducted at other ports and airports. A8 migrants mainly use regional airports which operate budget flights from A8 countries. This would cause migrants from the A8 countries to be under-represented in the survey and hence under-counted, particularly as the number of arrivals from those countries has increased from bout half a million a year to two million.
16. We conclude that it is likely that net immigration from the A8 countries has been under-counted in the international migration statistics. We have no way of determining the correct figure (although we suspect that the government may be able to do so by examining NI payment records) but if just half of the 2005 estimated inflow of A8 migrants stayed in the UK for a year or more this would roughly double the net flow of A8 migrants from 65,000 to 130,000. It would also point to overall net foreign immigration into the UK of over 350,000 in 2005 – by far the highest ever.
17. Even at these levels migration from the expanded EU would still only account for just over 40% of net foreign immigration.
18. If, therefore, we are to get net migration down to manageable and realistic levels we need first to limit what we can limit, namely the levels of international migration from outside the EU. We also need to impose enforceable restrictions on immigration of citizens from any countries which may join the EU in future.