International migration in 2002
10 May, 2004
Summary
1. On 29 April, 2004 the Office for National Statistics published its detailed estimates of international migration for 2002 [i].

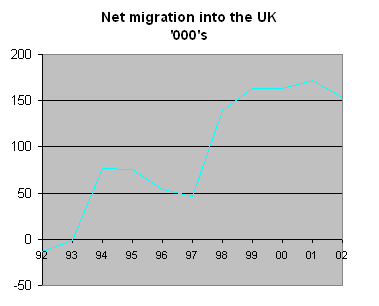
3. Gross immigration passed the half million mark for the first time. The figure at 512,800 was an increase of 57% on the 326,000 people who arrived in 1997.
4. In the year from mid-2001 to mid-2002 the United Kingdom population increased by 181,100. Two-thirds of this increase was due to net immigration and other changes and one-third due to natural increase, i.e. an excess of births over deaths. Immigration has now been the main component of population increase since mid-1998, accounting for 517,000 (nearly two-thirds) of the 792,100 increase in population in the period 1998-2002. Children born to immigrants after their arrival in the UK are not counted as migrants – if they were the proportion would be even higher.
5. Third-world countries and regions are the principal contributors of net immigration into the UK accounting for net immigration of approximately 187,000 people (84%) out of the net 222,000 people arriving from countries and regions which provide net immigration to the UK. In contrast the UK is a net exporter of people to the developed world – with a net 69,000 people moving to the rest of the EU, Australasia and North America.
6. 60% of net immigration in 2002 was to London. Two-thirds was to London and the South-East. The remaining net immigration was to the other England regions and to Wales. Scotland and Northern Ireland were countries of net international emigration.
7. The net immigration figure of 153,400 was equivalent to 0.26% of the UK’s population. However, the net gain of population is mainly in the 15-24 age group – 93,100 (61%) were in this age group. This is equivalent to 1% of the existing 15-24 population – that is out of every 100 people aged 15-24, 1 has migrated to the UK in the last year alone.
Detail8. The overall net immigration total for 2002 was confirmed as 153,400 in detailed international migration statistics released by the Office for National Statistics on 29 April, 2004. This continues the high levels of net immigration experienced since 1998 which has resulted in a net 790,000 people migrating into the UK in the period 1998-2002 – an average of 158,000 each year.
9. Gross immigration reached a record level of 512,000 of whom only 95,000 were returning British citizens. The gross immigration represents an increase of 186,000 (57%) over the figure of 326,000 seen in 1997. Gross emigration was also at a record level of 359,000 – but this represents an increase of only 80,000 (29%) over the figure of 279,000 recorded in 1997.
10. The UK’s population increased between mid-2001 and mid-2002 by 181,100. Natural change (excess of births over deaths) accounted for only 61,900 (approx one-third) of this. The remaining (two-thirds) was due to international migration and other changes [ii]. The population of England increased by 172,000 and Wales by 11,100. In the period from mid-1998 to mid-2002 net immigration accounted for an increase of 516,700 (nearly two-thirds) out of the total increase of 792,100 in the UK’s population.
11. The net international flow into the UK of 153,400 was made up of:
Net inflows|
Rest of Europe [iii] (i.e. outside EU) |
18,200 |
|
Americas |
4,100 |
|
Middle East * |
20,100 |
|
Other foreign |
87,500 |
|
South Africa |
17,000 |
|
Other African Commonwealth* |
36,600 |
|
Bangladesh , India, Sri Lanka* |
28,700 |
|
Pakistan * |
6,700 |
|
Caribbean Commonwealth * |
3,400 |
Note: The majority of the inflows (187,100 out of 222,300) are from the third-world countries and regions marked with an asterisk above.
Net outflows|
Australia |
13,300 |
|
Canada |
4,200 |
|
New Zealand |
5,400 |
|
European Union |
35,600 |
|
USA |
9,600 |
|
Other Commonwealth |
900 |
Note: All of the net outflows (69,000) people are to the
developed world.
12. 62% of net international migration (94,900 people) was to London – two-thirds (103,300 people) was to London and the South-East. The net flow to England was 160,500 and there was a small inflow of 1,600 to Wales. Scotland and Northern Ireland each had net outflows of 6,300 and 2,400 respectively.
13. The net inflow was heavily weighted towards younger people as follows:
|
Under 15 |
+12,600 |
|
15-24 |
+93,100 |
|
25-44 |
+69,300 |
|
45-59/64 |
-21,600 |
|
60/65 plus |
+ 100 |
In mid-2002 there were approximately 7.4 million people in the 15-24 age group – so migration is adding almost 1% per annum to this age group. That is out of every 100 people in the 15-24 age group, 1 has migrated to this country in the last 12 months.
Footnotes
| i | Series MN no 29 ISSN 0140-900X |
| ii | Other changes is a correction to reconcile estimated population and census figures, plus and adjustment for armed services. ‘Other changes’ have been included in the contribution made by migration to population change. |
| iii | Includes all countries of former USSR and Turkey |
