Migration Watch UK
11 July, 2013
Summary
1. The 2011 census revealed that net migration to England and Wales was around 500,000 higher than previously estimated for the previous decade. The Office of National Statistics (ONS) should now revise their estimates of historical net migration to ensure that they provide an accurate record. The census result means that net foreign migration from mid 1997 to mid 2010 for the United Kingdom was nearly 4 million, rather than the 3.4 million recorded in the immigration statistics published so far - a difference the size of Manchester.
Introduction
2 The 2011 census carried out across the United Kingdom found that the population was around 500,000 higher than had been estimated through using data on births, deaths and annual long term international migration statistics.
3 The 2011 census for England and Wales was carried out by the ONS. It found that the population of England and Wales on census day was 56,171,000. This was 464,000 greater than had been estimated by using data on births, deaths and annual long term international migration statistics[1]. The 2011 census in Scotland was overseen by the General Register Office for Scotland[2]. There too, the census day population of 5,295,400 was around 45,000 greater than had been estimated but a formal reconciliation is not yet available[3]. The differences in Northern Ireland are very small. For these reasons this paper focuses on the differences for England and Wales.
ONS estimates of net migration
4. Estimates for net migration for the whole of the United Kingdom as well as for England and Wales are carried out by the ONS. The primary source for estimating net migration is the International Passenger Survey (IPS). This is a sample survey that interviews a number of passengers at UK air and sea ports. Passengers who answer that they intend to come to or leave the UK for a year or more are identified as migrants.
5. The estimate for Long Term International Migration (LTIM) consists of this IPS data plus some additional adjustments. Some passengers change their plans and stay (or leave) for more or less time than originally intended. In doing so they may switch into becoming migrants (known as “visitor switchers”) or switch out of the definition of a migrant (“migrant switchers”).
6. There are also adjustments for asylum seekers and migrant flows between the UK and the Republic of Ireland.
Differences between net migration and census data for England and Wales
7. Before 2004 net migration from the EU8 countries of Eastern Europe was too small to be separately identified in the LTIM data. Between 2004 and 2010 net migration from the EU8 to England and Wales was estimated in the LTIM data at 316,000[4]. However, the population of those born in the EU8 rose from 105,000 in the 2001 census to 885,000 in the 2011 census. The population just of Poles in England and Wales rose by over 500,000 from under 60,000 in 2001 to 580,000 in 2011.
8. Taking into account a small number of deaths the ONS estimates that implied EU8 net migration derived from the census is around 800,000[5]. This is over 450,000 higher than the official LTIM estimate of 316,000. (Births in the UK to EU8 parents would be recorded as UK born so they are not included in these numbers).
9. A similar comparison shows that implied net migration from Western Europe (EU15) was around 300,000, greater by 100,000 than the 200,000 given in the official LTIM estimate. The implied Non-EU net migration in the census is broadly in line with the LTIM figure for the decade. The census also indicates that around 50,000 more British born emigrated than is shown in the LTIM data. In total this gives an implied net migration of around 500,000 higher than the official LTIM data, this is a rounded figure that is broadly in line with the extra 464,000 people in the population recorded in the census.
Explanations for the difference for England and Wales
10. Despite the census data on population by country of birth suggesting an underestimate of net migration by around half a million the ONS is only prepared to definitely assign an extra 344,000 to net migration[6]. This figure consists of 65,000 uncounted migrants from Ireland, 250,000 from the EU8 and some additional minor adjustments. The remaining 134,000 were labelled as ‘Other’ which the ONS describe as being either down to immigration or to uncertainties in the estimates.
11. The ONS believes that most of the EU8 migrants were missed from the IPS in the middle part of the last decade. Until 2009 the IPS survey was heavily focused on Heathrow. This meant that EU8 migrants arriving at the smaller airports (often served by budget airlines) were missed. After 2009 the IPS survey was changed to increase coverage away from Heathrow so as to better capture EU8 migration. Figure 1 below shows the annual increase in the population of those born in the EU8 countries (taken from the Annual Population Survey) and the annual net immigration from those born in the EU8.
Figure 1: A comparison of the annual change in the EU8 born population and net migration from the EU8[7]
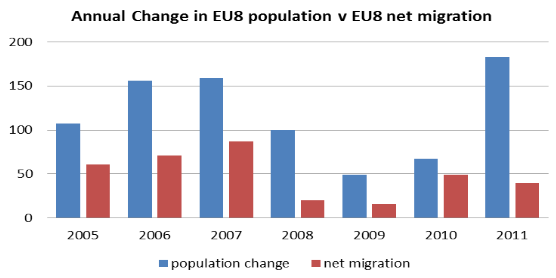
The annual increase in the EU8 born population has been higher in every year than the estimated net migration. Although this gap was reduced in 2010 (the year after the survey redesign) there is a huge difference in the figures for 2011. Although this is comparing two different estimates and so may have a wide margin of error, it does seem likely that the LTIM is still under recording the inflow of A8 migrants.
12. Another possible explanation for the difference is that the LTIM data has underestimated the number of visitor switchers for EU8 immigration. These would be migrants who might initially have said that they intended to stay in the UK for under a year but ended up staying for longer (or indefinitely).
13. The behaviour of non-EU and EU migrants may well be different. Non-EU migrants come to the UK for a specific purpose and have much less opportunity to vary the length of their stay. However, EU migrants have complete freedom of movement so can completely change their intentions about how long to stay in the UK. Therefore, it might well be the case that while the current method of estimating LTIM works reasonably well for non-EU migration it is less successful in identifying migrants from within the EU.
The implications for the official estimates of Net Migration
14. This additional migration from the European Union means that net migration was significantly higher than the official estimates currently state. The table below shows the contribution to net migration in the annual population estimates before and after the addition of migrants detected in the census data. The ONS has distributed the bulk of the EU8 migrants between 2004 (when EU enlargement occurred) to 2009 (when the IPS was improved). The other migrants were split across the decade on a cohort basis to reflect the age and sex of the population.
Table 1: Revised Net Migration estimates (thousands) for the mid-year population estimates of England and Wales mid 2001 to mid 2011[8]
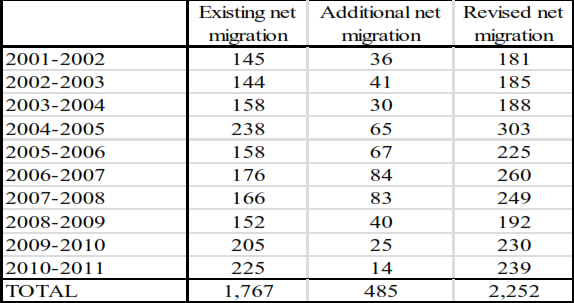
Source: Figure 3, Population estimates for England and Wales mid-2002 to mid-2010 (Revised), ONS
15. Previously when the ONS have identified improvements to their calculations of LTIM they have revised retrospectively their estimates of historical net migration. This has happened on a number of occasions. However, the ONS have not yet revised their estimates of net migration with the census data (and appear to have no plans to do so[10]).
The impact on Long Term International Migration Data for the United Kingdom
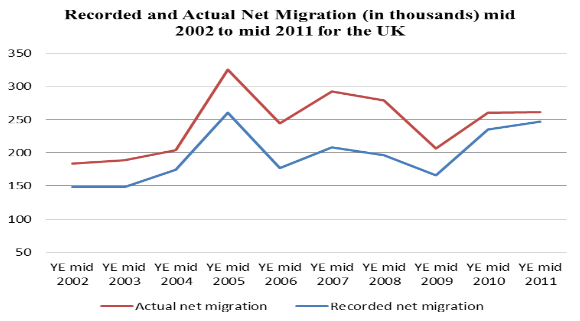
16. To illustrate the scale of impact of the census data on LTIM the additional net migration for England and Wales (outlined in Table One) has been added to the existing LTIM estimates for the United Kingdom in Figure 1 below (In reality net migration may be slightly higher than illustrated if it is the reason behind the additional population revealed in the Scottish census).
Figure 2: An illustration of recorded and actual net migration for the United Kingdom[11]
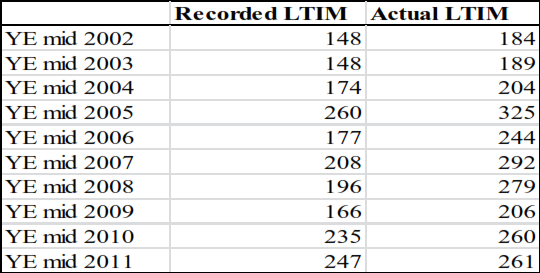
17. The revised numbers for the UK are shown in Table 2 below:
Table 2: Recorded and Actual Net Migration (in thousands) mid 2002 to mid 2011 for the UK
The significance of these revisions
18. The scale of mass immigration in recent years has been significantly greater than previously realised, thus presenting the coalition government with an even more difficult task in getting the numbers down. The census has revealed that net foreign born immigration was over 500,000 higher than previous estimated. This means that net foreign born migration between mid 1997 and mid 2010 is now found to be nearly 4 million rather than 3.4 million – a difference equivalent to the population of Manchester[12].