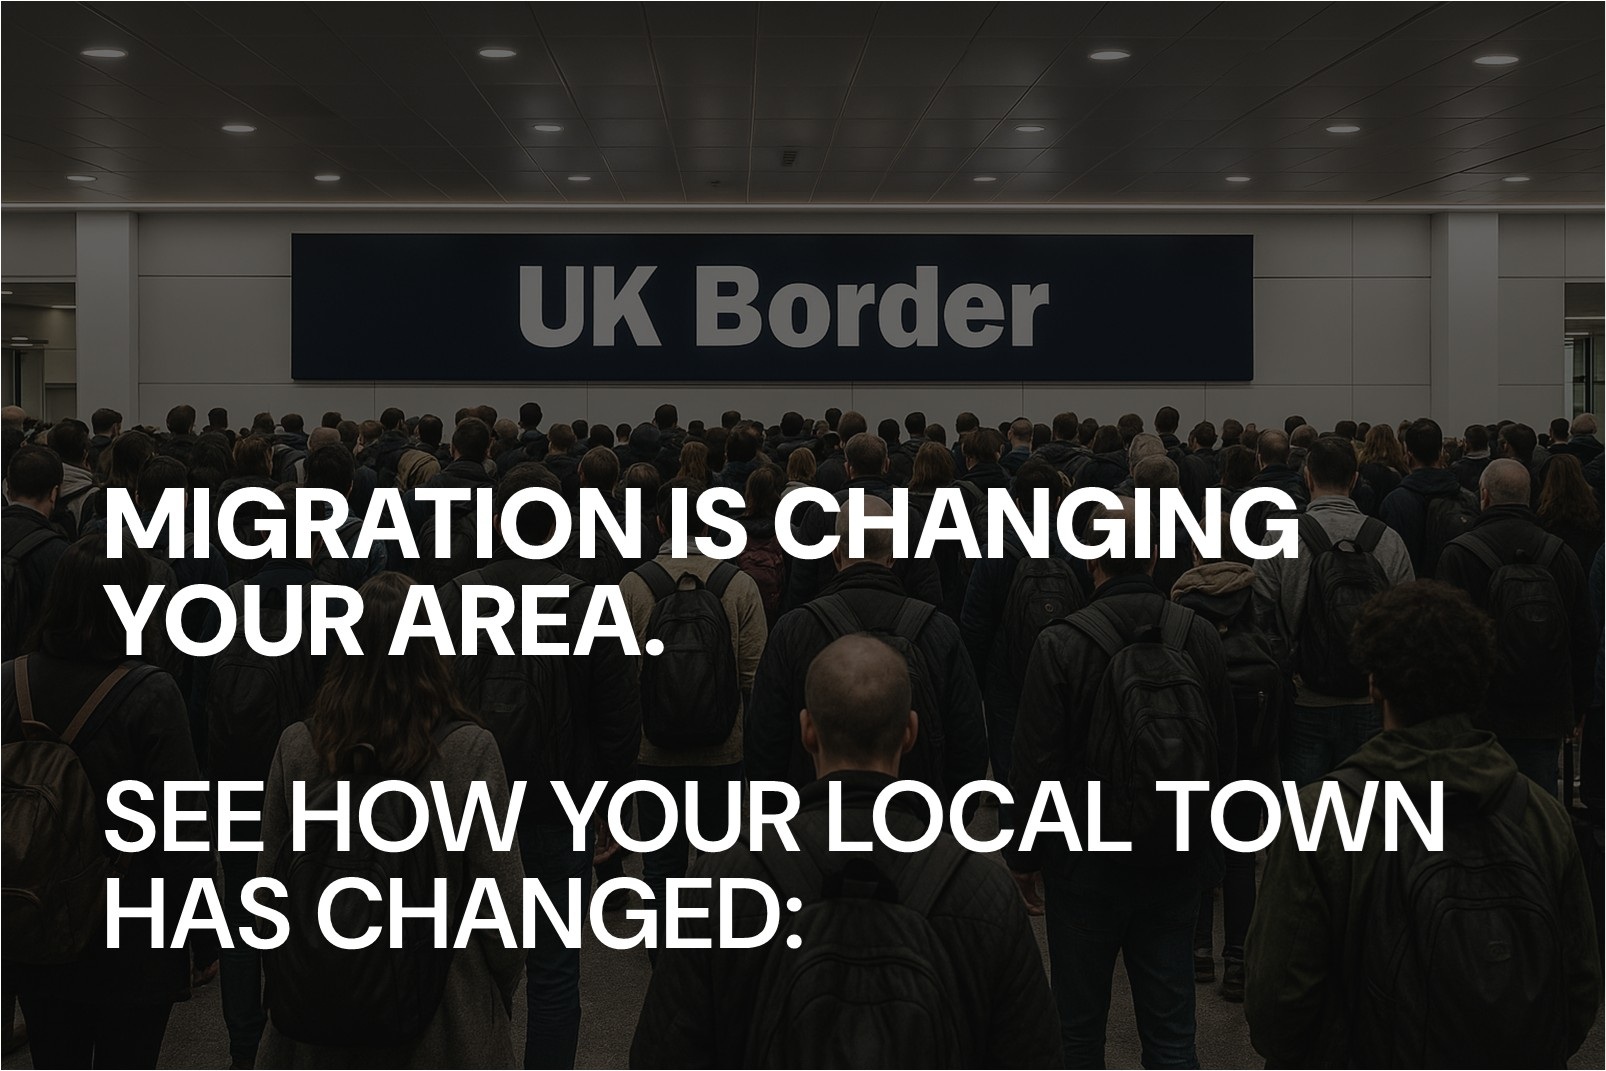
The Office for National Statistics (ONS) released its official estimates for the population of England and Wales yesterday, and the results make for dire reading.
Already the headlines are coming in thick and fast: “Migration fuels population jump, figures suggest” from the BBC; “Net migration fuels second-biggest population rise in 75 years”, says The Times; and “Britain’s population growth is now unsustainable” is The Telegraph’s editorial for the day. None of them are wrong; immigration is now the primary driver of population growth, and has been for years.
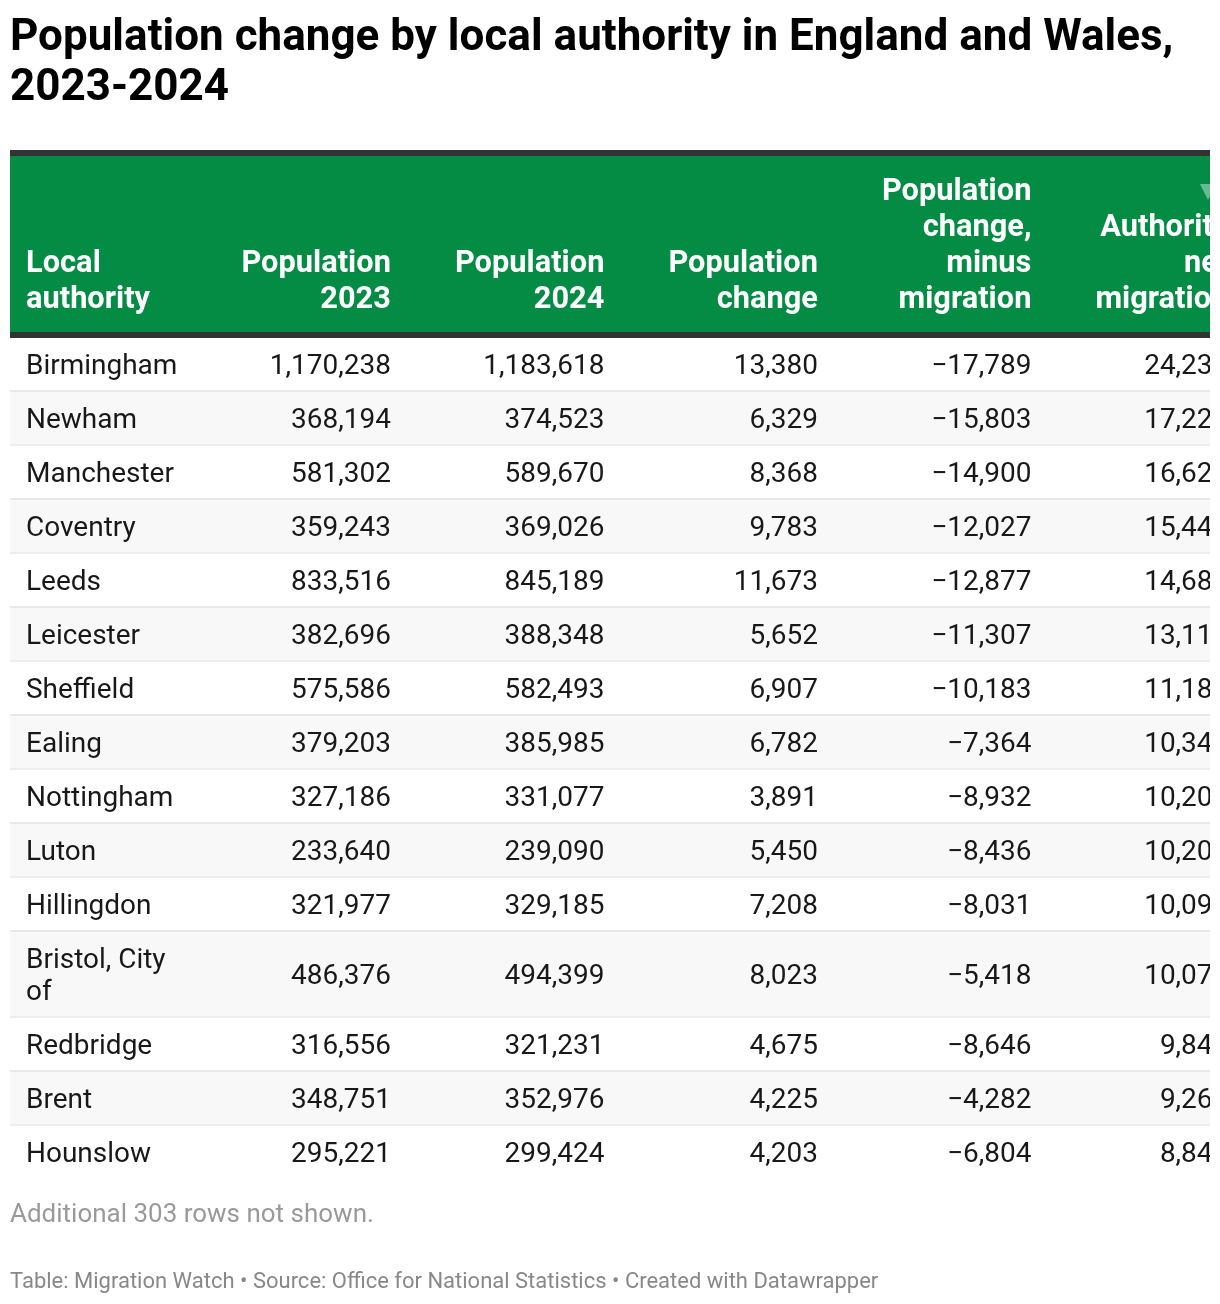
These figures merely confirm that. Across England and Wales, as many as one-third of all local authorities have seen their population increase due purely to immigration. The largest single increase is in Birmingham, where the net migration figure reached 24,235. If immigration had been zero, the city would have actually shrunk by 10,855. Newham, where the ethnic minority population was already around 70%, saw an increase of over 10%. Again, if net migration had been zero, the city would have shrunk.
Population change by local authority in England and Wales, 2023-2024
Page 1 of 22
| Local authority | Population 2023 | Population 2024 | Population change | Population change, minus migration | Authority net migration | |
|---|---|---|---|---|---|---|
| Birmingham | 1,170,238 | 1,183,618 | 13,380 | −17,789 | 24,235 | |
| Newham | 368,194 | 374,523 | 6,329 | −15,803 | 17,224 | |
| Manchester | 581,302 | 589,670 | 8,368 | −14,900 | 16,620 | |
| Coventry | 359,243 | 369,026 | 9,783 | −12,027 | 15,446 | |
| Leeds | 833,516 | 845,189 | 11,673 | −12,877 | 14,680 | |
| Leicester | 382,696 | 388,348 | 5,652 | −11,307 | 13,110 | |
| Sheffield | 575,586 | 582,493 | 6,907 | −10,183 | 11,185 | |
| Ealing | 379,203 | 385,985 | 6,782 | −7,364 | 10,342 | |
| Nottingham | 327,186 | 331,077 | 3,891 | −8,932 | 10,201 | |
| Luton | 233,640 | 239,090 | 5,450 | −8,436 | 10,200 | |
| Hillingdon | 321,977 | 329,185 | 7,208 | −8,031 | 10,093 | |
| Bristol, City of | 486,376 | 494,399 | 8,023 | −5,418 | 10,070 | |
| Redbridge | 316,556 | 321,231 | 4,675 | −8,646 | 9,842 | |
| Brent | 348,751 | 352,976 | 4,225 | −4,282 | 9,269 | |
| Hounslow | 295,221 | 299,424 | 4,203 | −6,804 | 8,847 |
Table: Migration WatchSource: Office for National StatisticsGet the dataEmbed Download imageCreated with Datawrapper
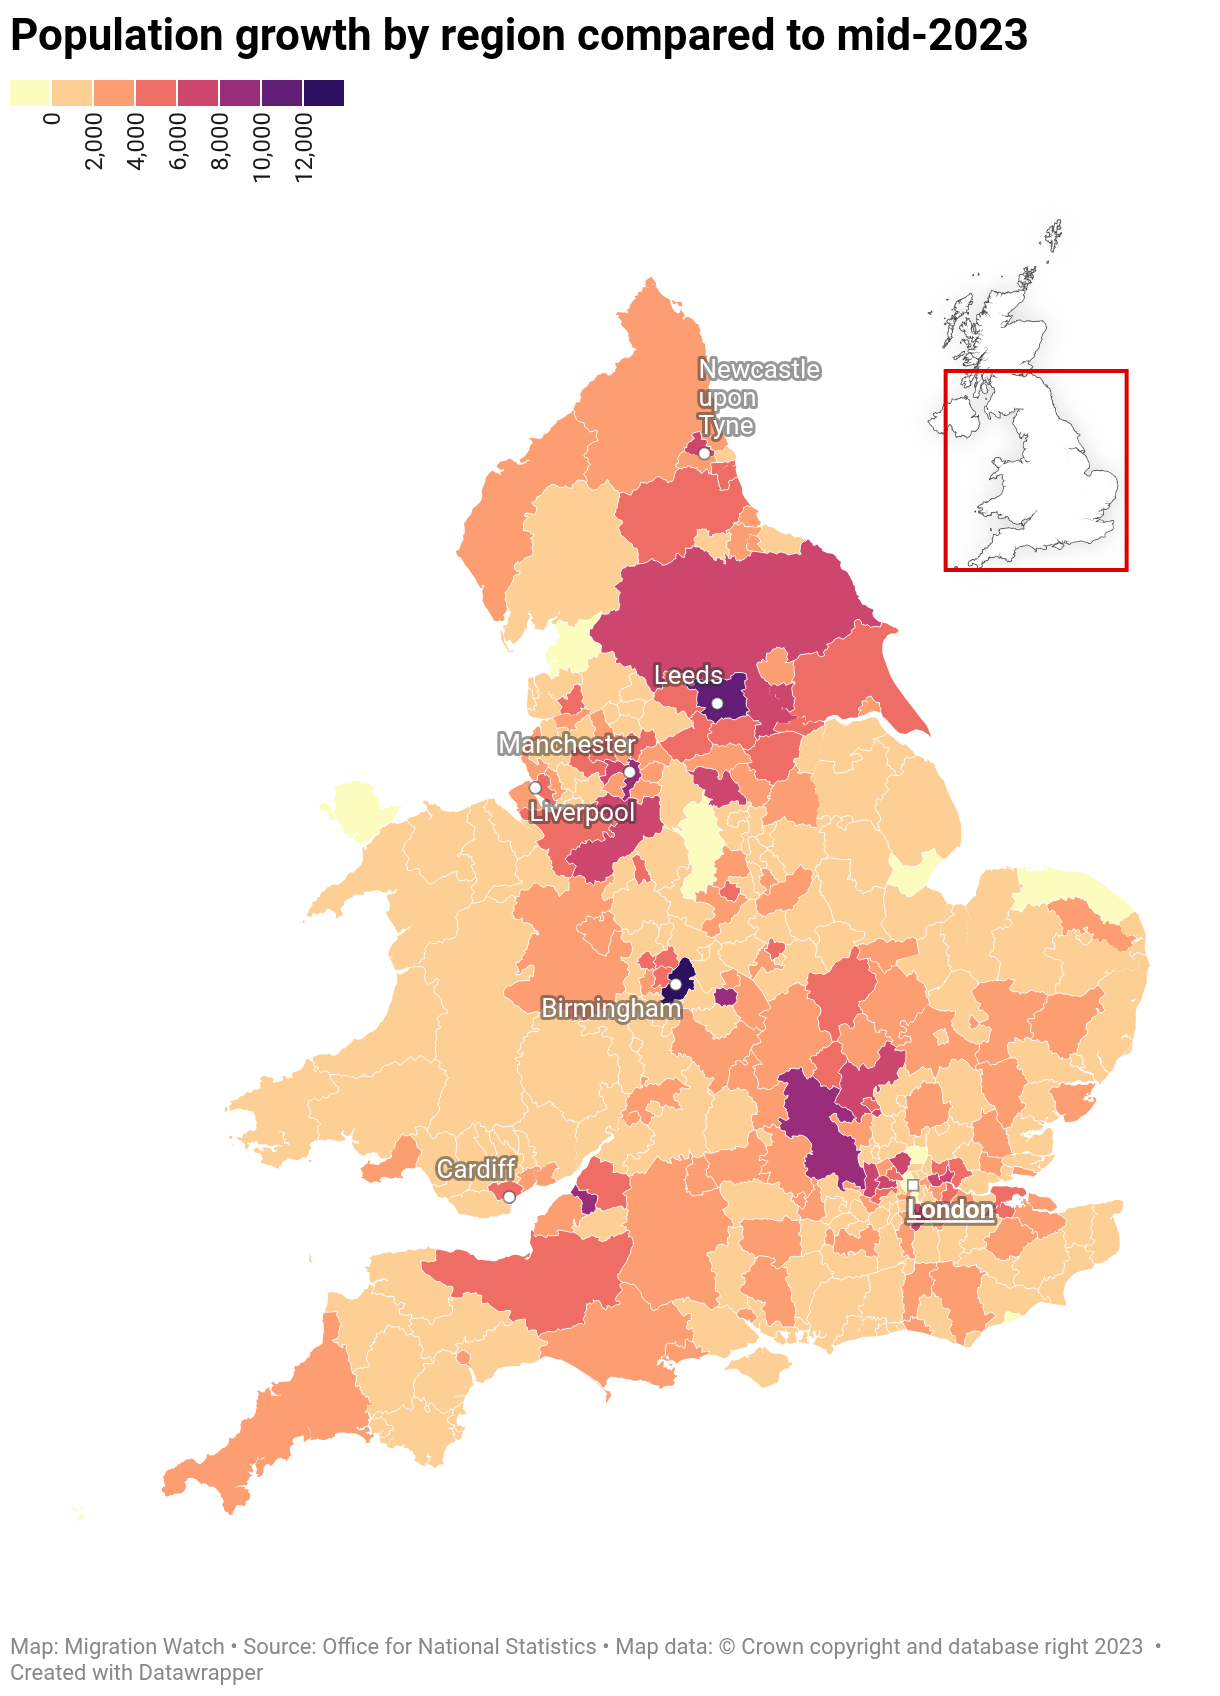
The scale of mass migration means England and Wales are changing before our very eyes; there is now a divergence between those areas of the country growing from natural growth (births minus deaths) and domestic migration (people moving across the country); and those areas growing as a result of net international migration. Two different Britains are emerging, and there is only one cause.
Population growth by region compared to mid-2023
02,0004,0006,0008,00010,00012,000
LondonLondonManchesterManchesterBirminghamBirminghamLiverpoolLiverpoolTyneuponNewcastleTyneuponNewcastleLeedsLeedsCardiffCardiff
Map: Migration WatchSource: Office for National StatisticsMap data: © Crown copyright and database right 2023 Get the dataEmbed Download imageCreated with Datawrapper
Even over the last year, population growth in certain parts of the country has been explosive – Leeds alone has seen a population increase of 11,000 in the last year, while Birmingham has experienced an enormous increase of 13,380 and, down the road, Coventry has grown by 9,783 – again, a product of immigration alone, with net migration to Coventry nearing 15,500.
By maps
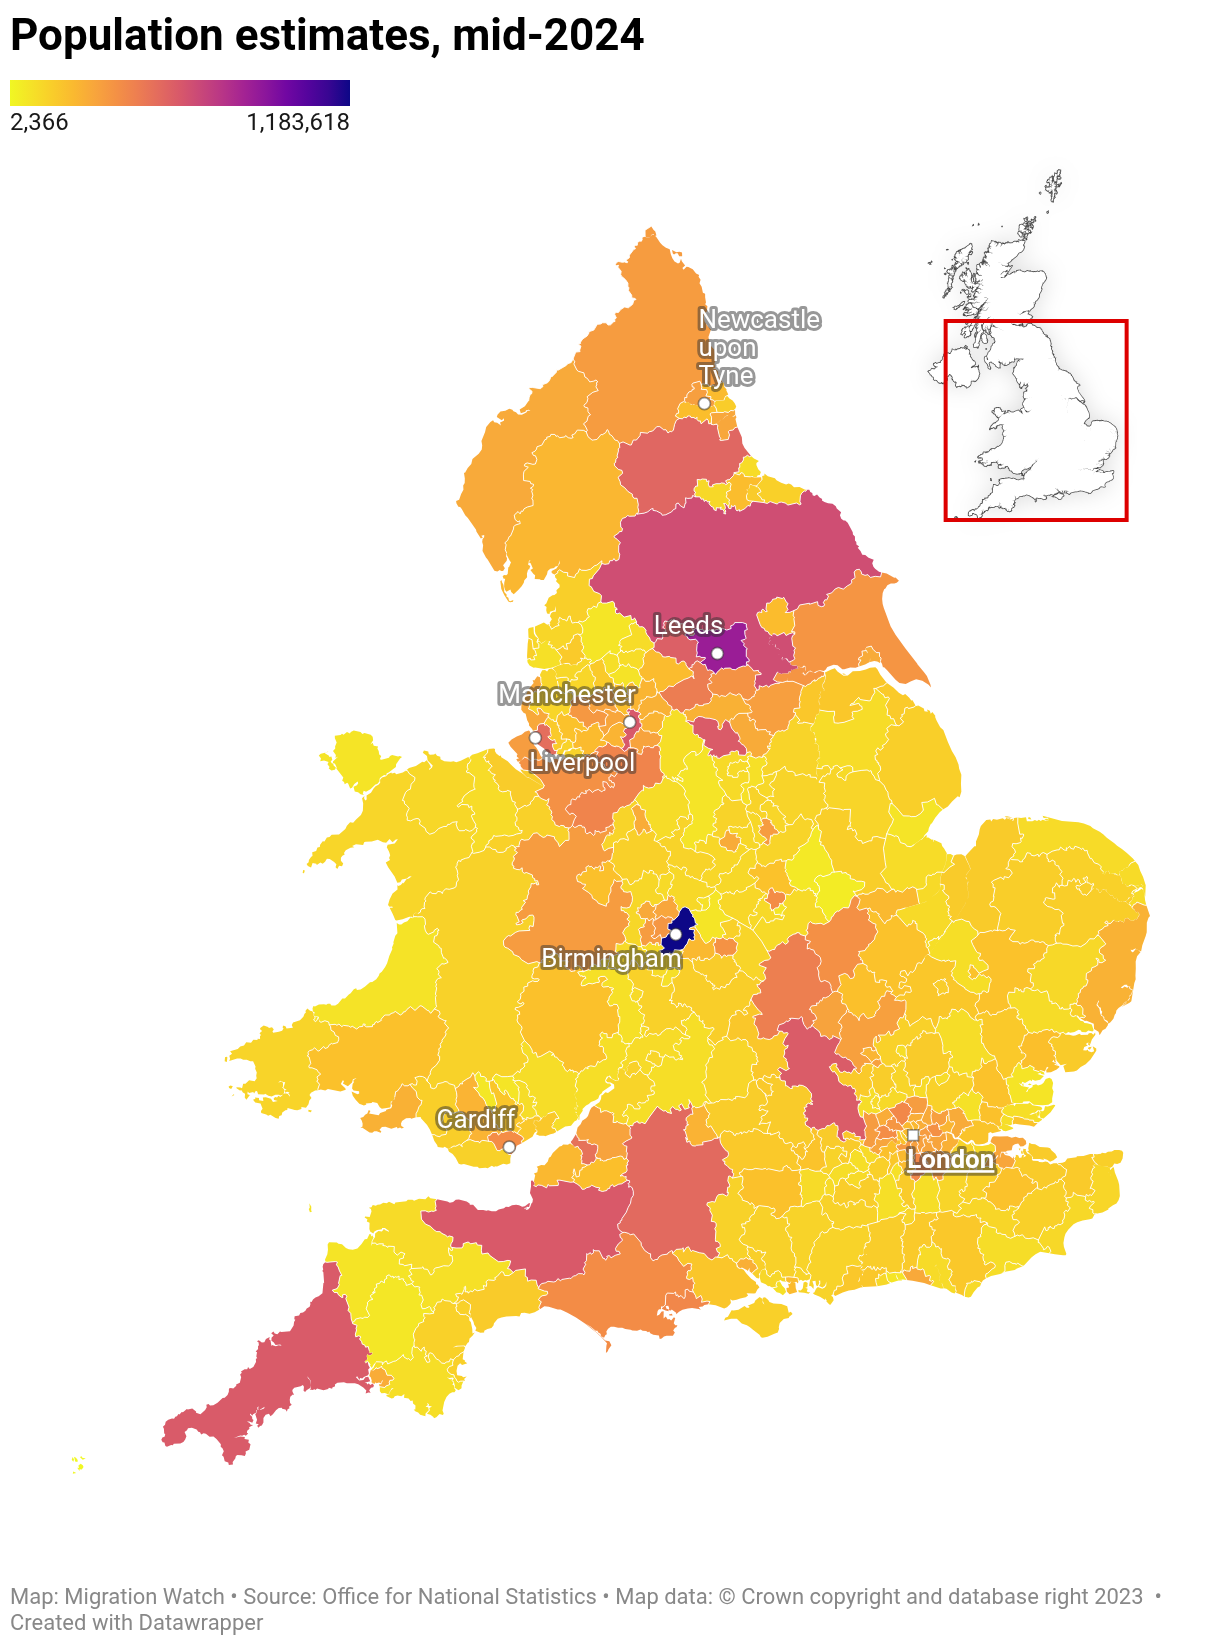
While these are still only estimates, and the mid-year data for 2024 for Northern Ireland and Scotland are yet to be released, this does allow us to see how England and Wales’ populations are shifting.
Population estimates, mid-2024
2,3661,183,618
LondonLondonManchesterManchesterBirminghamBirminghamLiverpoolLiverpoolTyneuponNewcastleTyneuponNewcastleLeedsLeedsCardiffCardiff
Map: Migration WatchSource: Office for National StatisticsMap data: © Crown copyright and database right 2023 Get the dataEmbed Download imageCreated with Datawrapper
The overall density of England and Wales is cause of concern in itself: the concentration of populations around cities like Birmingham and Leeds – highly dense cities with significant levels of existing deprivation– is a microcosm of the increasing strain that population growth, and therefore immigration, is placing on local services.
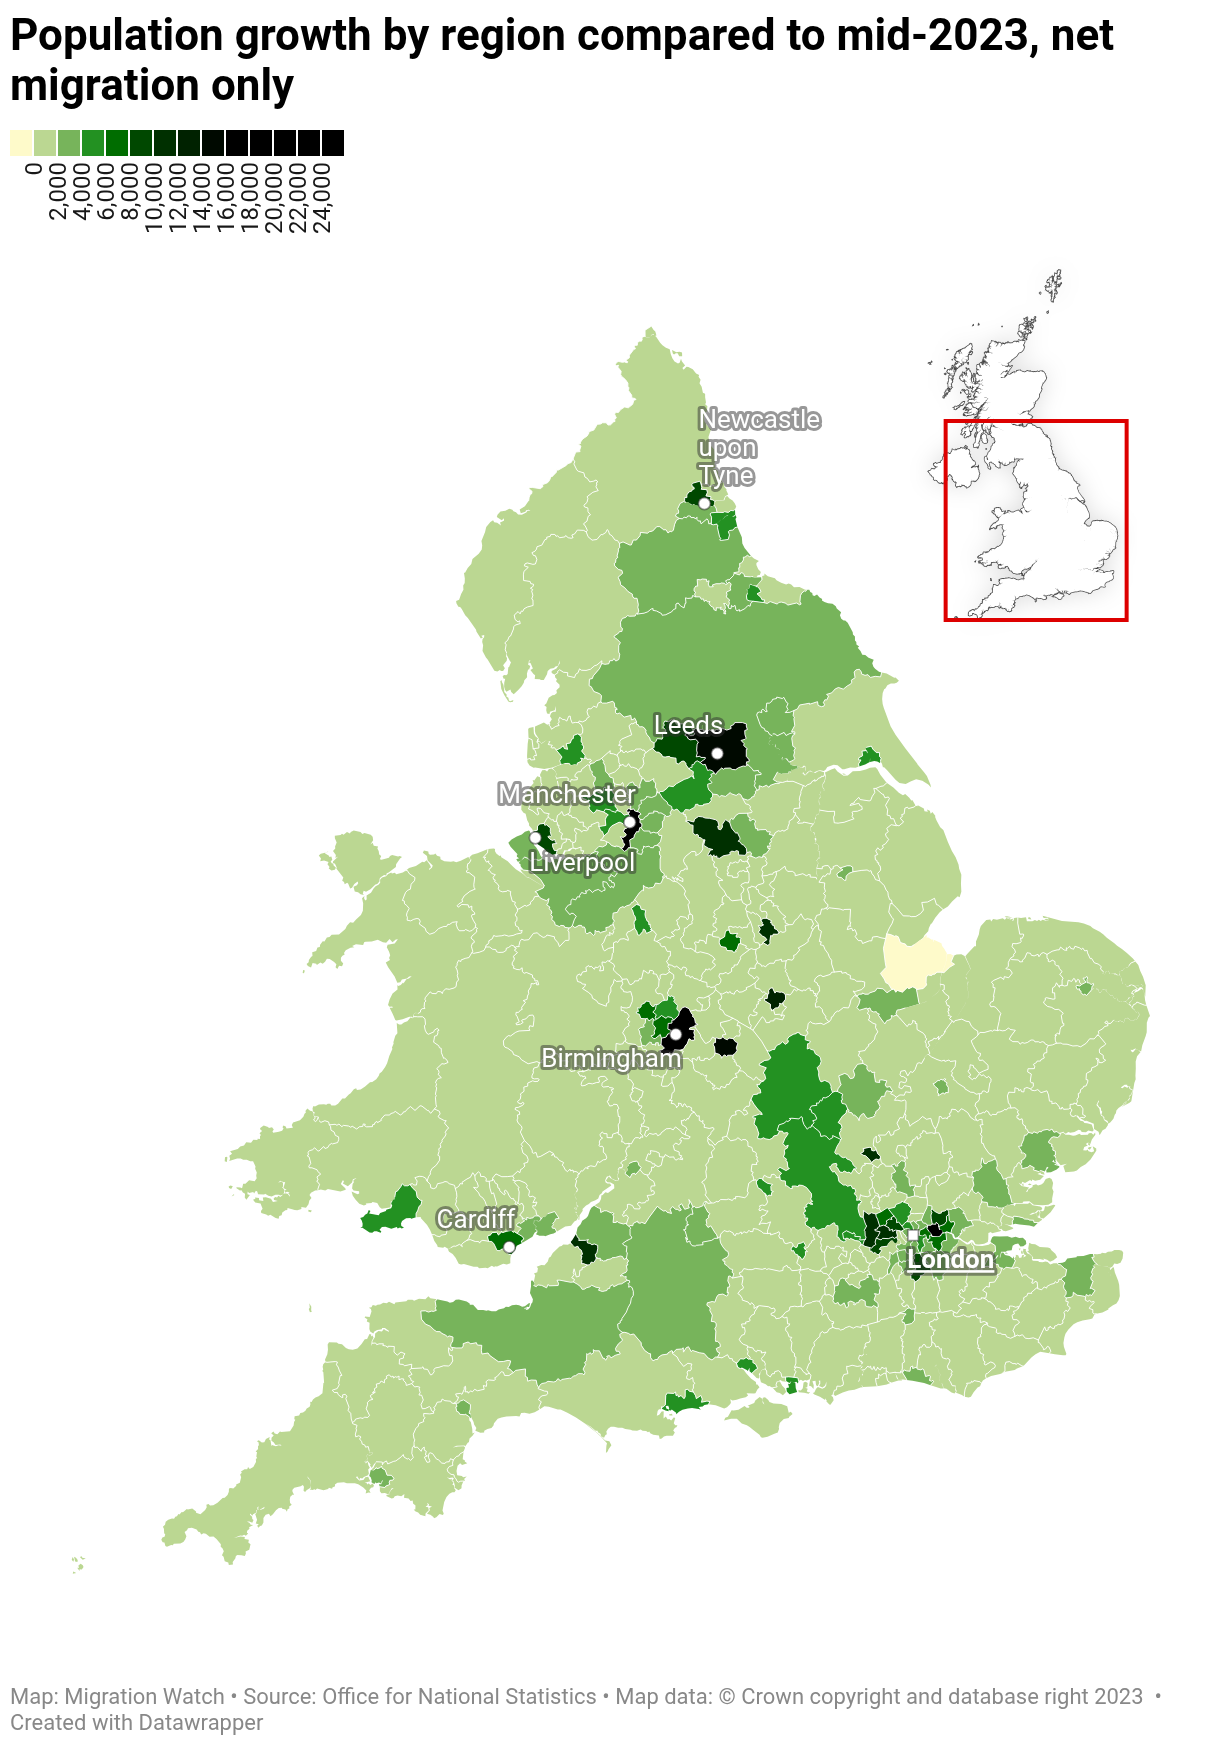
Population growth by region compared to mid-2023, net migration only
02,0004,0006,0008,00010,00012,00014,00016,00018,00020,00022,00024,000
LondonLondonManchesterManchesterBirminghamBirminghamLiverpoolLiverpoolTyneuponNewcastleTyneuponNewcastleLeedsLeedsCardiffCardiff
Map: Migration WatchSource: Office for National StatisticsMap data: © Crown copyright and database right 2023 Get the dataEmbed Download imageCreated with Datawrapper
If we readjust our parameters to look at where the population is growing in the country most as a result of immigration, we can see that Birmingham (24,235) is still a major recipient of net migration. However, cities like Manchester (16,620), Bristol (10,070), Coventry (15,446) and Leicester (13,110) have grown even faster in percentage terms, given their lower starting populations. The uneven distribution of immigration into the country means British cities will increasingly look unlike the white British-majority countryside that surrounds them. This will only become more acute as this massive scale of immigration continues.
Runaway numbers
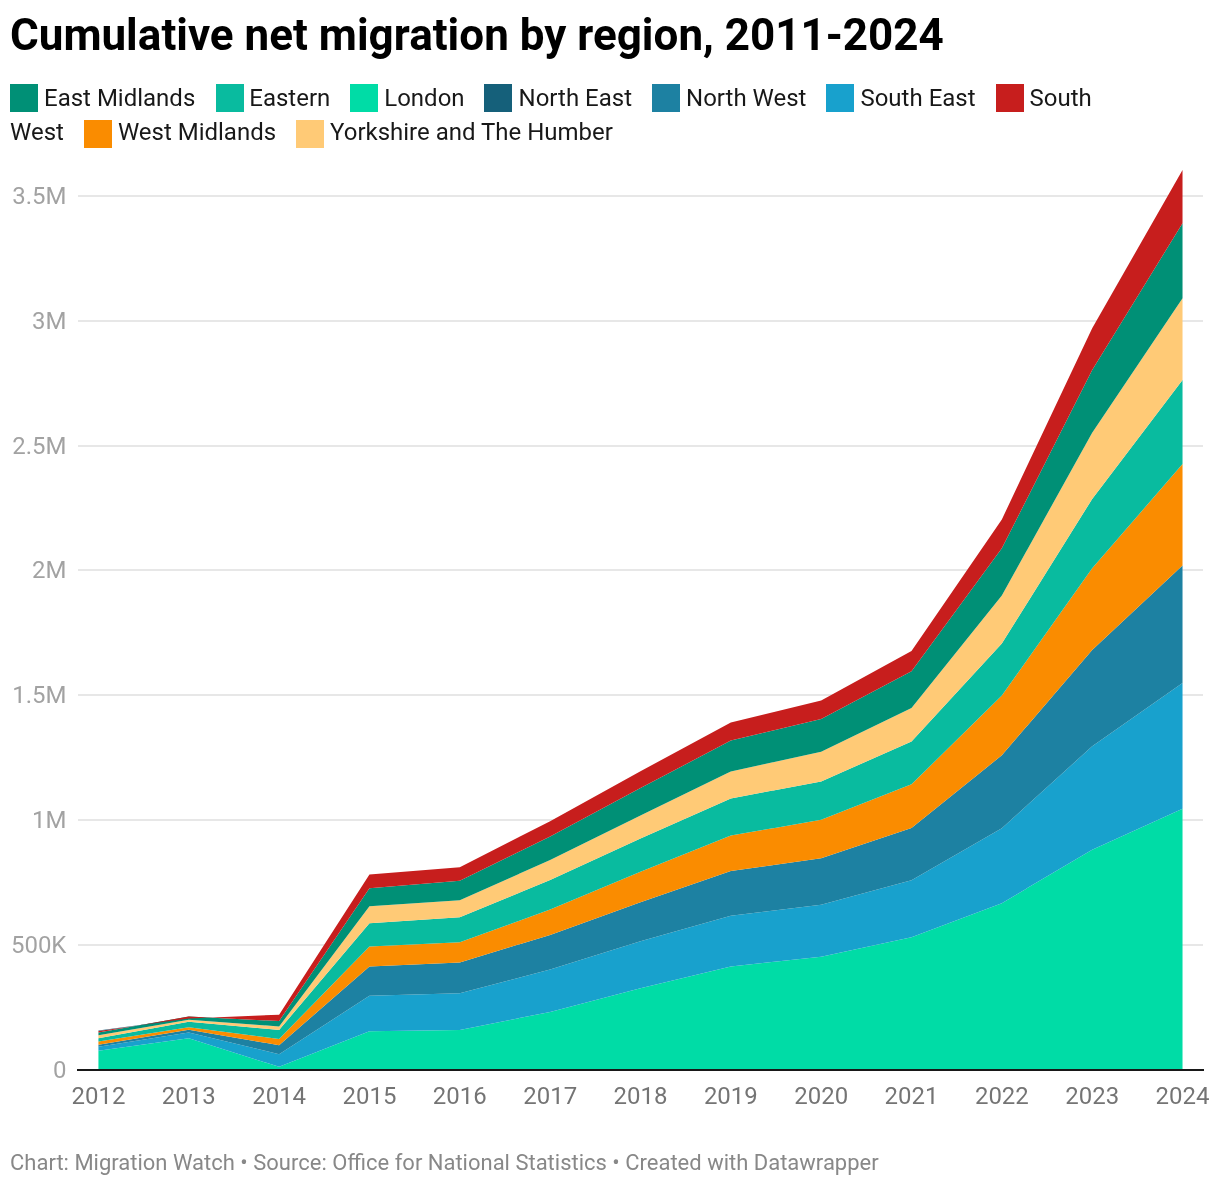
But this is not simply a recent problem. We know that migration has been out of control since the mid-1990s, but since 2011, cumulative migration in the regions across England and Wales has been completely transformative.
Cumulative net migration by region, 2011-2024
East
Midlands
Eastern
London
North
East
North
West
South
East
South
West
West
Midlands
Yorkshire
and The Humber20122013201420152016201720182019202020212022202320240500K1M1.5M2M2.5M3M3.5M
Chart: Migration WatchSource: Office for National StatisticsGet the dataEmbed Download imageCreated with Datawrapper
Net migration by region has completely run away with itself. Between 2011 and 2024, over three and a half million people have arrived in England alone, and one-third of that (1,045,564) have been arrivals into London. For London, the population of which was 8.9m in the 2021 census, the cumulative net migration figures mean that over 11% have arrived in the last decade and a half.
No region has been left untransformed by the complete dereliction of duty that has defined our border security.
No cap, no control
Immigration is not an abstract issue of numbers. Unchecked and uncontrolled, it has enormous impacts on the culture, safety, and demography of the country – and we have been experimenting with the unknown for far too long.
It’s time a government was brave enough to impose a centrally-determined cap on the number of migrants. Otherwise your area will continue to change beyond recognition.
