Immigration from Romania and Bulgaria
16 January, 2013
Summary
1. The precedent of East European immigration between 2004 and 2011 provides a basis on which to estimate future migration from Romania and Bulgaria. Like Poland in 2004 their GDP per head is only about one fifth of that of the UK and both suffer from high youth unemployment. The minimum wage is only about £1 per hour in both countries. This time round other EU countries will also have to open their labour markets but only Germany and the Netherlands seem likely destinations. Access to welfare in the UK is relatively simple and low wages are topped up by in work benefits. The existence of Roma minorities of 2.5 million amount to a wild card in any predictions. That apart, our central estimate is that immigration from these two countries will add 50,000 a year to the UK population for the next five years of which about half is likely to be captured in the immigration statistics. Conclusions are at paragraph 27.
Introduction
2. The government have been very reluctant to publish an estimate of likely future migration from Romania and Bulgaria when the transition period ends on 1 January 2014 and workers from these countries will have free movement throughout the EU[1]. They are no doubt conscious that the Labour government relied on a study of A8 migration[2] in 2004 which turned out to be hopelessly wrong, by a factor of eight – we described it at the time as “simply not credible” and “almost worthless.”[3]
The A8 Experience
3. This time round we have the example of the A8 countries, notably Poland, as a template. The Polish born population of the UK rose by nearly 550,000 from 95,000 to 643,000 between 2004 and 2011. Poles accounted for about 60% of A8 migration.
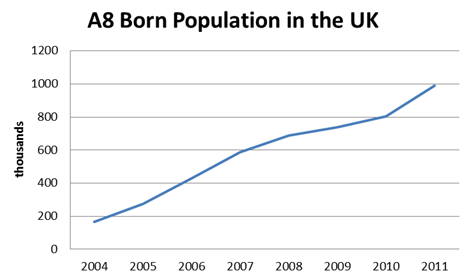
4. The A8 born population increased by 820,000 from 167,000 in 2004 to 988,000 in 2011 as shown below. The rate of increase slowed during the recession but has since accelerated.
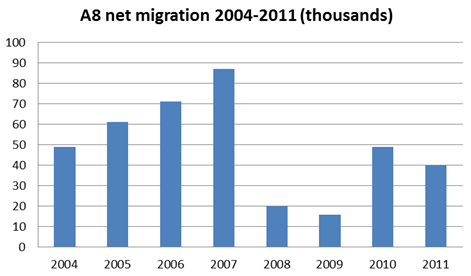
5. Net migration from the A8, as recorded in the LTIM figures[4] was only 393,000. This is important as it suggests that the immigration figures only picked up half the true net inflow. They also show clearly a drop during the height of the recession and a subsequent recovery.
Relative wealth
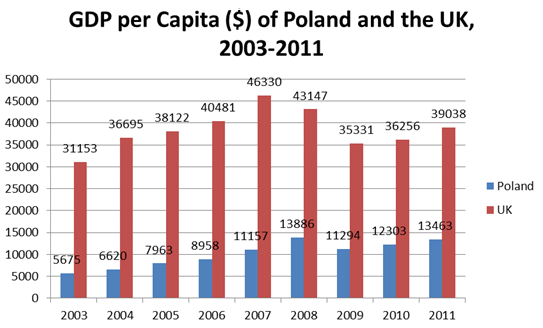
6. A major factor in the scale of Polish and East European migration to the UK since 2004 has been the very wide difference in wage rates. In 2004 when the A8 countries joined the European Union, the UK had a GDP per Capita of $36,695, over five times higher than Poland’s $6,620. The most recent estimates in 2011 show Poland to have a GDP per capita of $13,463 compared to the UK’s $39,038.[5]
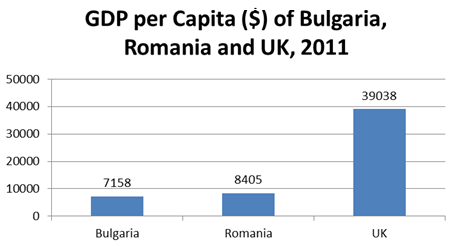
7. Today the disparity of wealth with Romania and Bulgaria is very similar. In 2011 the UK’s GDP per Capita stood at $39,038. This is four and a half times higher than Romania and almost five and a half times higher than Bulgaria. The minimum wage in both countries is only about £1 per hour.[6] Even allowing for the difference in the cost of living, this is still only a sixth of the UK minimum wage.[7] In addition the UK minimum wage is topped up by a variety of in-work benefits.
Size of Populations
8. Romania has a population of 21.3 million and Bulgaria 7.5 million. This is to be compared with Poland’s 38 million and a further 34 million in the other A8 countries.
Existing Communities
9. The presence of a community of the same nationality is a major pull factor since friends and relatives can guide new comers towards jobs and accommodation. In the case of Poland there was a population of 80,000 in the UK in March 2004, just prior to Poland’s accession to the EU. At present there are an estimated 94,000 Romanians and 47,000 Bulgarians in the UK.[8]
Cost and Ease of Travel
10. At present Romanians and Bulgarians need a work permit of some kind to enter the UK for work. Furthermore travel arrangements are nothing like as developed as they have become with Poland. We can expect that bus and airline services between Romania and Bulgaria and the UK will expand very rapidly as they did in the case of Poland.
Employment Opportunities
11. The ability to find a job at what, to these migrants, is a much higher rate of pay will be the key to the inflow. Employers have shown a strong preference for East European workers. They have proved to be good workers who are also very cheap and flexible. It will not be long before employment agencies specialise in bringing Romanians and Bulgarians to the UK. From the point of view of at least some employers, there are no contracts, no union problems, no grievance procedures, no redundancy, and no holiday pay, pensions or overtime. There is no maternity / paternity leave and no need to provide job security. It is therefore no surprise that employers find East Europeans very convenient.
12. Youth unemployment is high in both countries as it was in Poland in 2004. It is especially high in France, Spain and Italy making these countries less likely destinations – see Annex A.
Language
13. Language is an important factor in obtaining employment. In the past Romanians have been attracted to Italy and Spain partly because of some similarity in their own language to Italian and Spanish. Young Romanians are now more likely to have some English than, for example, German.
Access to benefits
14. As soon as they can find work, Romanians and Bulgarians will have full access to benefits including in-work benefits. A family of four in which one adult works at half the average wage is able to almost double its post-tax income through housing benefits, family benefits (child tax credits and child benefit) and in-work benefits such as the working tax credit. Only in three other countries would a family of four be able to top up their post-tax income by more than in the UK – in Denmark, Ireland and Luxembourg.[9] Romanian and Bulgarian nationals already have access to the labour markets of the former two. Even if they cannot find work they only have to show that they are “habitually resident” – a loosely defined condition that is easily fulfilled - to claim unemployment benefit which, while less generous than in other EU countries, comes with virtually no conditions, unlike other member states where contributions are a key determinant of access.[10]
Social Housing
15. EU nationals who are considered “habitually resident” have to be treated exactly the same as British applicants in their requests for social housing. As allocation is based primarily on “need” large families in conditions deemed overcrowded will get priority over smaller British families. The full extent of this is hard to estimate since the survey question on nationality for those entering social housing is voluntary. In London less than half of the new lets of social housing record the nationality of the tenant.
The A8 pattern
16. The factors examined above suggest that an inflow on roughly the scale of the A8 may be expected. They added 100,000 a year to the UK population over the eight years 2004-2011. The combined population of Romania and Bulgaria is about 29 million compared to 72 million for the A8. Scaling this by 3/7 gives an annual addition of 40,000. However not all of this will be captured in the immigration figures; on the same pattern as the A8 (para 5 above) only some 20,000 will appear in the LTIM numbers.
17. Mr Philip Hollobone claimed in Parliament on 4 December 2012 that there could be “an increase of some one third of a million over present levels, possibly within two years”.[11] This seems exaggerated, particularly in respect of the timescale. He took the number of A8 migrants over the past eight years as a percentage of their total population, about 1.5%. He then applied it to the population of Romania and Bulgaria to give a total inflow of 270,000 which he rounded up to one third of a million. This was then divided into two years.
An alternative approach
18. Another approach would be to look at the number of National Insurance numbers (NINOs) issued to Romanian and Bulgarians. Before they joined the EU in 2007 the annual number was about 6,000 a year. Since 2007 the average has been 35,000 – partly due to the Seasonal Agricultural Workers Scheme. NINOs are a measure of those arriving to work. They are not cancelled on departure (because they are used for pensions) and they may not include dependants but they are a broad guide to inflows. At this point one can only attempt a broad estimate. However, given the factors outlined above, it seems highly unlikely that the impact on NINOs as a result of opening the UK labour market will be less than to double it and it could easily treble it. This would give a range of 70 – 100,000 NINOs a year. In the case of Poland the issue of one million NINOs between 2004 and 2011 led to an increase in the population of Poles in the UK of half a million. One might therefore expect a population increase of Romanians and Bulgarians of 35 – 50,000 a year of whom half would appear in the immigration statistics, say 17 – 25,000.
A population approach
19. A third approach would be to examine the development of the Romanians and Bulgarian populations in the UK. The former increased by 70,000 and the latter by 33,000 between 2004 and 20011. If these populations can increase by 25,000 a year despite restrictions on the labour market it is reasonable to imagine that this rate of growth could double or even treble to between 50 and 75,000 a year of which half would appear in the immigration statistics – say 25-37,000 a year.
The new circumstances
20. There are number of reasons why the A8 pattern might not be a precise model:
- The British economy
Access to the A8 was granted at the beginning of an economic boom which has turned into a recession. However, after falling at first, A8 migration has risen from a low point of 15,000 to 40,000. This suggests that the pull factors have remained powerful despite slower overall growth. - The welfare state
Access to the welfare state in the UK is extremely simple compared to elsewhere in the EU and changes to the system in recent years top up low wages, especially for married workers with children. - Other destinations
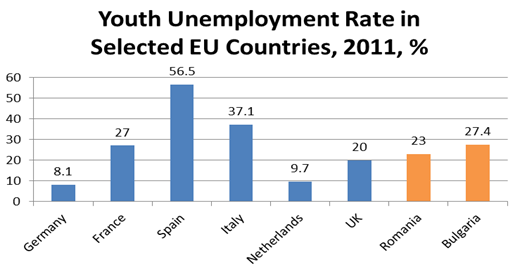
In 2004 only the UK, Ireland and Sweden opened their labour markets to the A8. On this occasion all EU countries are obliged to open their labour markets. Fifteen of the smaller EU countries and Italy have already done so. Given the youth unemployment rates in the larger countries - Spain (56%), Italy (37%) and France (27%) (Annex A) - these seem unlikely destinations. Apart from the UK (20%), only Germany (8%) and the Netherlands (9.7%) seem potential candidates.
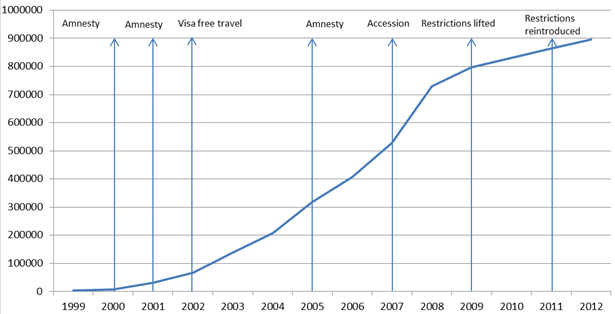
Spain
21. As regards Spain, the Romanian population increased very rapidly from 2000 to 2009 as shown in the graph below. Its growth has since slowed but their number does not seem to have been much affected by Romania’s accession to the EU in 2007. Spain lifted the labour market restrictions in 2009 but effectively re-imposed them in 2011 in response to serious disturbances of the labour market. By that time 30% of Romanian workers were unemployed.[12] One factor in the rapid growth in the number of Romanians may have been Spain’s amnesties for illegal immigrants in 2001 and 2005 which granted status to a total of one million people. In short there has been a huge flow of Romanians into Spain which has levelled off as the economic situation there has deteriorated but there is still an inflow of about 30,000 a year.
22. In order to qualify for unemployment benefits in Spain a worker must have at least 360 days’ worth of social contributions in the preceding six years. This can be transferred from any state. However an individual who has 360 days’ worth of social contributions is only entitled to unemployment benefits for 120 days. The maximum time that unemployment benefit can be claimed is two years, at which point entitlement must be proved again, requiring another 360 days’ worth of social contributions in work. This means that those Romanians who found themselves unemployed in 2011, unless they have since found work in the legitimate labour market, are likely to have come to the end of the period in which they can claim unemployment benefit, or are about to do so.
Italy
23. In 2002 the EU lifted visa restrictions for Romanian nationals which resulted in a wave of emigration. By 2005 the Romanian population of Italy was 248,849. In 2007 it was 432,200 (with many having their status legalised for the first time as result of Romania’s accession to the EU). By 2011 it had doubled to an estimated 968,000
24. The Romanians seem to have demonstrated a preference for migration to Spain and Italy. Much now depends on how they react to the economic difficulties in those countries. Some may decide to transfer to northern Europe and new migrants may make the same choice.
The Roma Factor
25. There are 2.5 million Roma in Romania and Bulgaria. They are heavily discriminated against in their own countries and some have already arrived in Britain. The Roma, therefore, are a wild card in connection with future migration from these countries.
The Polish precedent
26. The Poles have shown the way. Potential migrants will soon know, if they do not already, how successfully the Poles have found work in Britain and have been able to send substantial sums home. This will certainly be of interest to the Romanians who already have large diaspora estimated at more than four million, including nearly one million in Italy and Spain, half a million in the US, 160,000 in Germany and 85,000 in the UK.[13]
Conclusion
27. As in 2004, there is no purely statistical basis on which one could estimate the likely future flows of migration from Romania and Bulgaria. It is a matter of judgement, taking into account the factors outlined above. Our view is that they are likely to add between 30 and 70,000 to our population in each of the next five years of which about half will appear in the immigration statistics. So our central estimate is 50,000 a year or 250,000 in five years. However, that number could be considerably higher if there were to be a movement of Roma to the UK or if some of the nearly one million Romanians in both Spain and Italy should transfer to Britain. Beyond that time frame it is not useful to speculate.
Annex A
Unemployment in the EU
Unemployment in the EU is at an historic high, reaching 11.8% in November 2011 – that is 26.1 million people out of work. Within the EU economies are faring very differently – unemployment has increased in 18 states and decreased in seven, with two remaining stable. The highest unemployment rates are in Spain (26.6%) and Greece (26%) and the lowest in Austria (4.5%), Luxembourg (5.1%), Germany (5.4%) and the Netherlands (5.6%).
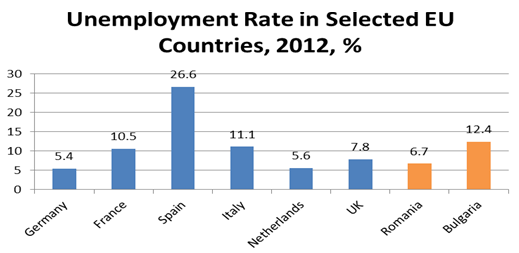
(The figure for the UK relates to the period August to October 2012, Labour Force Survey. The Eurostat data relates to November 2012.)
In November 2012 youth unemployment reached 23.7% for the whole of the EU. In Spain and Greece over half of young people (aged 16-24) are unemployed. In the UK youth unemployment reached 20% by the end of 2011 but has since fallen to 18.2% (August to October 2012, LFS).
Footnotes
- Romanian and Bulgarian citizens are already able to work without restrictions in Bulgaria, Cyprus, Czech Republic, Denmark, Estonia, Finland, Greece, Hungary, Italy, Latvia, Lithuania, Poland, Portugal, Romania, Slovenia and Sweden. From 1st January 2012 Romanian and Bulgarian workers could work unrestricted in Ireland. Spain lifted transitional controls in 2009 however in 2011 introduced restrictions on Romanians wishing to work, using a safeguard built in to European treaties.
- The countries formerly known as the A8 countries are Czech Republic, Estonia, Hungary, Latvia, Lithuania, Poland, Slovakia and Slovenia.
- Migration Watch UK, Briefing Paper 4.1, ‘The Impact on Immigration of the EU expansion to Eastern Europe’, 27 July 2003, URL: http://www.migrationwatchuk.org/briefingPaper/document/33
- Long term immigration based on the International Passenger Survey.
- GDP per Capita Data, World Bank, URL: http://data.worldbank.org/indicator/NY.GDP.PCAP.CD All GDP per Capita figures are WB data.
- Eurostat, Minimum Wage Statistics, URL: http://epp.eurostat.ec.europa.eu/statistics_explained/index.php/Minimum_wage_statistics
- Show -6 more...
- Romanian and Bulgarian citizens are already able to work without restrictions in Bulgaria, Cyprus, Czech Republic, Denmark, Estonia, Finland, Greece, Hungary, Italy, Latvia, Lithuania, Poland, Portugal, Romania, Slovenia and Sweden. From 1st January 2012 Romanian and Bulgarian workers could work unrestricted in Ireland. Spain lifted transitional controls in 2009 however in 2011 introduced restrictions on Romanians wishing to work, using a safeguard built in to European treaties.
- The countries formerly known as the A8 countries are Czech Republic, Estonia, Hungary, Latvia, Lithuania, Poland, Slovakia and Slovenia.
- Migration Watch UK, Briefing Paper 4.1, ‘The Impact on Immigration of the EU expansion to Eastern Europe’, 27 July 2003, URL: http://www.migrationwatchuk.org/briefingPaper/document/33
- Long term immigration based on the International Passenger Survey.
- GDP per Capita Data, World Bank, URL: http://data.worldbank.org/indicator/NY.GDP.PCAP.CD All GDP per Capita figures are WB data.
- Eurostat, Minimum Wage Statistics, URL: http://epp.eurostat.ec.europa.eu/statistics_explained/index.php/Minimum_wage_statistics
- The UK minimum wage is currently £6.19, URL: https://www.gov.uk/national-minimum-wage-rates
- Annual Population Survey, 2011, URL: http://www.ons.gov.uk/ons/.../august-2012/population-by-country-of-birth-and-nationality-datasets.xls
- Migration Watch UK, Briefing Paper 4.16, Comparison of UK Benefits with those of the EU14, 9 December 2012, URL: http://www.migrationwatchuk.org/briefingPaper/document/284
- Migration Watch UK, Briefing Paper 4.16, Comparison of UK Benefits with those of the EU14, 9 December 2012, URL: http://www.migrationwatchuk.org/briefingPaper/document/284
- Mr Philip Hollobone, Westminster Hall Debate on Immigration (Romania and Bulgaria), 4 December 2012, Column 203WH, URL: http://www.publications.parliament.uk/pa/.../halltext/121204h0001.htm
- European Union Press Release, ‘The Commission accepts that Spain can temporarily restrict the free movement of Romanian workers’, 11 August 2011, URL: http://europa.eu/rapid/press-release_MEMO-11-554_en.htm