Key Findings
- Between 2001 and 2008, immigration was responsible for almost 40 per cent of the growth in the number of households.
- Migration is projected by the Government to increase the numbers of households in the UK by over 2 million in the twenty-five year period from 2008 to 2033 – that is about 36% of the projected increase.
- On present official projections we will need to build over 200 houses every day over the next 25 years to house the extra population arising from immigration.
- Even if house building were to increase by 25 per cent over current levels (to about 200,000 a year), over the next 25 years, there will be a shortage of around 800,000 homes by 2033 – equivalent to the combined current number of homes in Leeds, Manchester, Newcastle and Nottingham, or equivalent to a quarter of all the homes in Greater London.
- Allowing for second home ownership, empty dwellings, regional shortfalls and other factors, the overall shortfall in the supply of homes could be over one million.
The Importance of Housing
1. Housing is a basic human need, probably the most important aspect of life after food, sustenance and basic security, and essential to the quality of life, the wider environment, the health and well-being of people and the efficient functioning of the economy. The social and economic effects that follow from the impact of migration on housing are therefore potentially very wide ranging as can be appreciated from the following data:
- Housing in the UK is the biggest single item of spending in family budgets, bigger even than spending on food, accounting for 20 per cent of all expenditure
- Investment in new housing accounts for 20 per cent of all fixed investment in the economy, totalling some £39 billion (total investment in all housing – not just newbuild – is very much bigger than this)
- The total value of the UK’s stock of housing has been estimated at some £4 trillion, three times bigger than the entire GDP of the UK and more than half of the GDP of the United States
- The housing market in countries like the UK and USA, which have a large proportion of owner-occupied homes funded by credit (mortgages), is a critical influence on consumption and hence macroeconomic growth and stability
- Public spending in the UK on housing (mostly subsidy for construction of social homes) was some £15.6 billion in 2009/10. (This excludes spending on housing benefit and other forms of ‘social protection’ linked to housing)
- Housing is a major source of UK Greenhouse Gas (GHG) emissions, contributing about 25 per cent of these, mostly generated by energy use from the home. Additionally, construction of new homes is also a major generator of GHG emissions
- UK businesses in a survey reported that an adequate supply of housing is important for their business performance, believing that the limited availability of affordable housing in some key areas – especially London – was exerting a negative impact.
International Migration into England in the Past Decade
2. Between 2000 and 2009 net long term international migration into England averaged about 175,000 each year, or 1.7 million in total. The pie chart below illustrates that three quarters of migrants settled in four of the nine English regions – London , which took over 40%, followed by Yorkshire and the Humber (14%), and the South East and East of England (both 10 %).
Figure 1: Immigration by Region in England
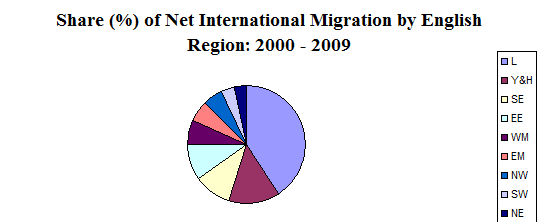
Source: ONS
3. Data on housing supply, household formation rates, estimates of the contribution of migrants to the latter, and the overall balance between the net growth of the housing stock and household numbers is set out in Table 1 and Figure 2, covering the period 2001 to 2008. The key points to note are:
- Almost 40 per cent of all households[1] formed in England during this period are estimated to have been formed by migrants (Line F)
- In the two regions most heavily impacted by immigration – London, Yorkshire & the Humber – the percentages of new households were 93 per cent and 48 per cent respectively (Line F)
- These regions also have the most serious housing shortages (Line C)
Table 1: Increase in Households and Housing Stock By Region in England: 2001 – 2008 (‘000s)
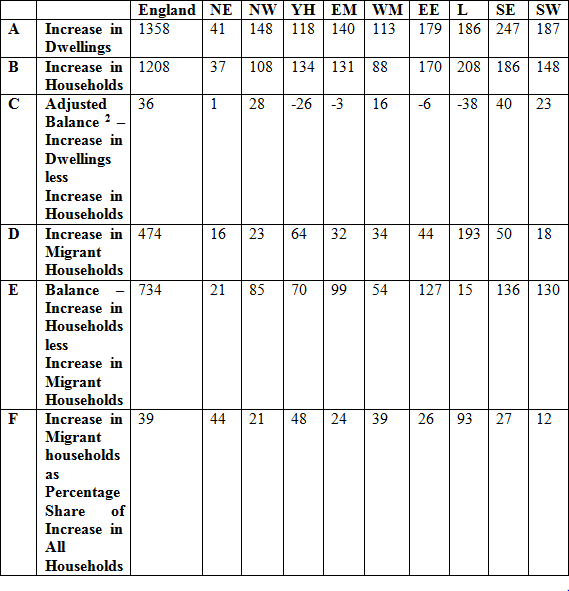
Source: ONS, DCLG
Note: all numbers are rounded
Figure 2: Housing Supply and Demand in England
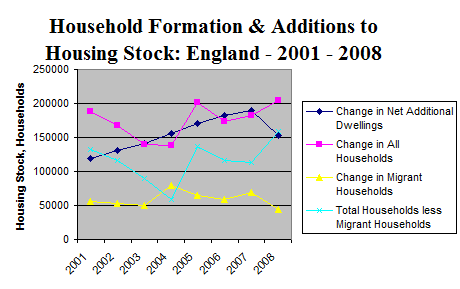
Source: ONS, DCLG
Figure 3 illustrates the relationship between housing shortages and migration in the English regions.
Figure 3: Immigration and Housing Shortages in England
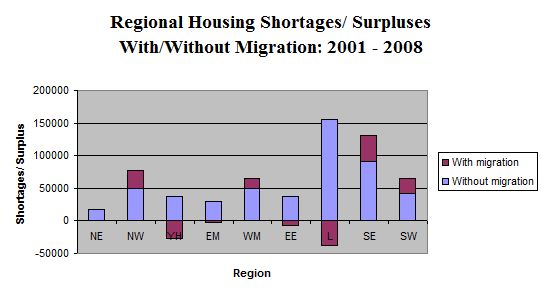
Source: ONS, DCLG
Projected Impacts
4. Net migration at current projected levels (180,000 a year) accounts for over two thirds of projected population growth and 36 per cent of projected household formation.
5. The Government in its latest twenty-five year projection of household numbers in England forecast that households in England will increase by 232,000 each year to 2033, an increase of 5.8 million households compared with 2008, with the biggest increases occurring in South East England, followed by London and North West England. The smallest increase in household numbers is projected to be in North East England.
6. Using the ‘Zero Net Migration’ variant projection it is possible to estimate the impact of immigration on household formation over the period from 2008 to 2033. Without any net migration at all, the Government projects that household formation each year should decline to 149,000 which implies that net immigration over this period will lead to 83,000 additional households each year, or slightly over 2 million (2,075,000) over the twenty five year projection period. These projections imply that to satisfy demand for housing caused by immigration we will need to build over 200 extra homes every day over the next 25 years.
7. The ability of the house building industry in the UK to satisfy in full this consequent increase in demand for homes is problematical. The 2008 – 09 recession resulted in a particularly steep decline in the house building industry. UK housing starts fell 41.2 per cent in 2008, the biggest annual fall in at least three decades with another fall on top of this of 14 per cent in 2009. After the severe construction industry recession of the early 1990s the house building industry took many years to recover. Figure 4 shows the trend in completions of new houses in England over the past two decades.
Figure 4: Housebuilding in England
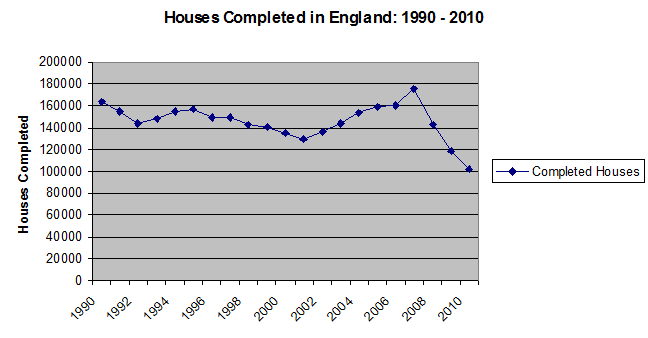
Source: DCLG
8. For the sake of analysis, we consider three house building scenarios:
(1) ’business as usual’ – under which houses continue to be built at the current rate of around 160,000 a year
(2) ‘substantial but realistic increase’ – under which there is a long –term increase of one quarter in homes provided, equivalent to an average of 200,000 additional homes a year
(3) ‘homes for the future’ – under which homes are built in line with the assumption of the previous Government’s housing policy (set out in ‘Homes for the Future’) that 240,000 new homes could be provided each year
Table 2: Housing Supply and Household Demand: 2008 – 2033 (‘000s)
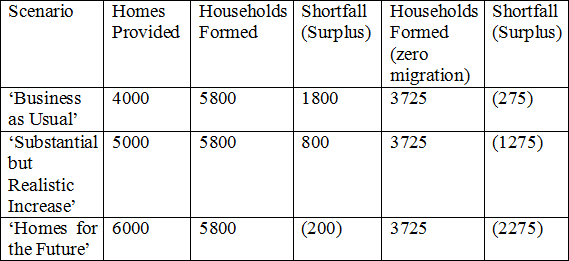
9. The most likely scenario is the second one. Using this, a shortfall of some 800,000 homes is projected over the next 25 years. In fact, the actual shortfall will be much bigger – over one million – if account is taken of second homes, properties that are allowed to be left empty, demand from ‘hidden’ households[3], unsatisfactory accommodation and other factors affecting supply and demand for dwellings, to which must be added the current estimate of households in need of net additions to the housing stock (150,000)[4].
Methodology
10. Migrant household numbers in the period 2001 – 2008 are estimated by assuming that on average a household is formed for every three migrants – an assumption that households of newly arrived migrants are significantly bigger (30 per cent) than for the indigenous population of the UK where average household size is 2.3 persons[5].
Data Sources
International Migration by Region: 2 Series (LTIM Calendar Year) – Table 2.06 Areas of Destination or Origin within the UK – available at: http://www.statistics.gov.uk/statbase/Product.asp?vlnk=15053
Housing Supply: Housing Statistics DCLG. Go to ‘Live Tables’, then Table 118 – Annual Net Additional Dwellings, England and the Regions: 2000/01 – 2009/10 – available at: http://www.communities.gov.uk/housing/housingresearch/housingstatistics/
Household Projections: Table 403 Household projections by Region, England 1971 – 2033; Table 416 Variant Household Projections – available at: http://www.communities.gov.uk/publications/corporate/statistics/2033household1110
Footnotes
- A household is defined as: (a) a person living alone; (b) a group of people living at the same address who share common housekeeping or a living room. A household does not necessarily equate to a dwelling but there is a strong correlation between the two.
- The balance – the difference between housing supply and housing demand (from household formation) – has been adjusted to account for other factors (like second home ownership, long – term empty properties and ‘hidden’ demand) that affect both supply and demand – see Table 3, page 11 of the Shelter report on future housing needs. Available at: : http://england.shelter.org.uk/__data/…/Homes_for_the_Future_amended_Feb_09.pdf
- ‘Hidden Households’ are people who live as part of another household but would prefer to set up their own household. An example would be adult children forced to remain living in the family home because unable to afford their own accommodation.
- Shelter, Available at: http://england.shelter.org.uk/__data/…/Homes_for_the_Future_amended_Feb_09.pdf
- Based on a Parliamentary Answer given to Lord Rooker on 8 Dec 2004 which said that about 59,000 additional households per year are attributable to net international migration [based on net migration of 130,000 p.a.] compared with 38,000 p.a. [based on net migration of 65,000 p.a.]