How Immigration Affects the Size of Our Population
1 September, 2009
Summary
1. It is wrong to suggest that population projections are based on a simple extrapolation of immigration trends. With
immigration now accounting for nearly 70% of projected population growth, it is important to understand the complex
process involved. This paper explains it in layman’s terms. An ONS study in 2007 found that, over the past 50 years,
their projections for 20 years ahead had been accurate to about 2.5%.
Introduction
2. Since the early 1990s immigration has become an increasingly important factor in the population projections for the
UK. The projected impact of migration upon future population size can be determined by comparing a projection without
migration with a projection including migration but with the same rates of fertility and mortality. On that basis,
migration is projected to account for 69% of our population growth up to 2031[1] and, in the longer term, for 100%,
including births to post-2006 immigrants.
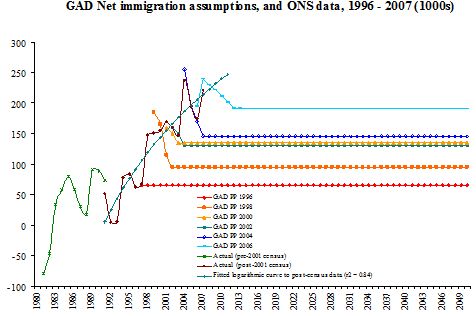
3. These population projections have to be made on the basis of assumptions about future immigration, mortality and fertility. The migration assumptions are the most difficult to make as migration is such a complex process. Much is unpredictable. In recent years, the Government Actuary’s Department, in common with most statistical offices overseas, has assumed that future migration will continue at about the level of recent years. That, however, is a conservative assumption, not an extrapolation of trends. The trend is of a general increase since the 1990s. An extrapolation of those trends would lead to an assumption of continually rising net immigration to levels well over 200,000, as shown in the simple curve fitted to the data in the graph below. A Home Office publication published in 2001 projected a similar upward trend[2]. The assumptions do not attempt to predict the impact of changes in government policy or of changed economic circumstances. However, an analysis of recessions over the past forty years indicates that any resultant reduction in immigration is temporary.[3] The Passenger Survey data released on 27 Aug 2009 suggest that the recession has led to a greater outflow of EU citizens, especially from the new Eastern European members; immigration from the rest of the world has not been much affected. Once the usual adjustments have been made, the net immigration level is likely to be about 150,000 for 2008[4].
Methodology
4. The current methodology goes back to 1991 but, until 1996, the assumption was that net immigration would return to
zero, in line with government policy at the time. The following diagram shows how the immigration assumption has since
been raised six times in response to the rapid increase observed in net migration.
Definitions and sources
5. Migrants are defined as individuals who change their country of usual residence for a period of at least a year, so
that the country of destination becomes the country of usual residence. The principal source is the International
Passenger Survey (IPS) which became operational in 1964. It is a voluntary sample of interviews of persons entering or
leaving the UK. A number of adjustments are made to the IPS totals (see para 7 below). The IPS has been criticised as
being an inadequately small voluntary survey, initially designed for other purposes. It has also not provided complete
coverage of ports and airports (currently 42). The sample size is being increased along with other improvements.
Method
6. Future migration is estimated for individual successive years up to 2015 on the basis of recent past trends and after
that is assumed to be constant. Gross inflow and gross outflow are projected forward separately using a statistical
model. Net migration is obtained as the difference between the gross IPS inflow and gross IPS outflow.
Adjustments
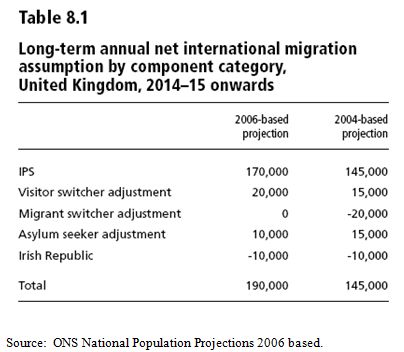
7. The adjustments made to the projected IPS figure for the 2006 based projection were as follows:
(a) Visitor Switchers.
People who enter the UK initially for a short stay but subsequently decide to remain for a year or more are known as
"visitor switchers" (+20,000)
(b) Migrant Switchers.
People who originally intended to come as migrants but in reality stay in the UK or abroad for less than one year are
known as "migrant switchers". These are now judged to cancel out so no adjustment has been made in the latest
projections.
(c) The Irish Republic.
This adjustment relies mainly on information from the Central Statistics Office in Ireland. Since 1997 there has been a
consistent annual net outflow from the UK of about 10,000 and this has been taken as the assumption for the future.
(d) Asylum Seekers.
The information for this element comes from the Home Office asylum statistics which suggest an annual inflow of 25,000
and an outflow of 15,000 giving a net inflow of +10,000 for the assumption. Those estimates do not, however, include the
dependants of asylum seekers.
8. These assumptions are set out in Table 8.1 of the 2006 Population Projections which is reproduced below.
The Sources of Migration
9. The ONS have applied the same projection method to flows between the UK and for different groups of countries
- the Old Commonwealth and USA
- the New Commonwealth
- the European Economic Area (EEA)
- the rest of the world.
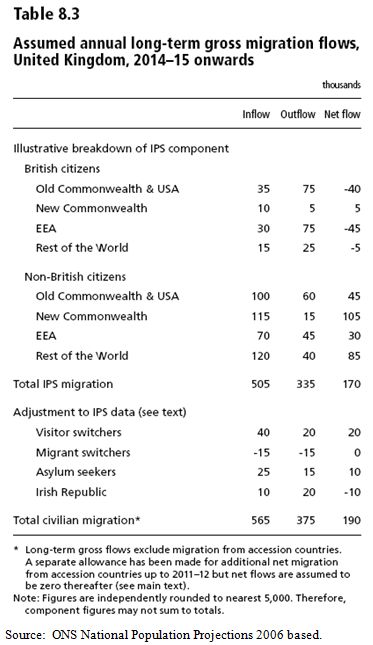
The results show that future net migration is expected to be almost entirely from the New Commonwealth and the rest of the world. This is apparent from Table 8.3 of the 2006 Projections reproduced below.
Migration from Eastern Europe
10. To avoid the possibility that migration from A8 accession countries might distort underlying trends, A8 migration
flows for 2003 to 2005 were excluded from the IPS modelling. In the latest projections, an allowance has been made for
additional net migration from Eastern Europe totalling +150,000 over the 5 years from 2007/8 to 2011/12. No allowance
has been made for these countries for the years beyond 2011/12 and there is clearly great uncertainty about this. Until
the recent financial crisis most experts (including Migrationwatch) believed that net migration from these countries
would come back towards balance.
Illegal Immigration
11. No explicit or separate allowance has been made in these projections for illegal migrants entering the UK. Such
inflows must be considerable, given that the Home Office itself published an estimate of 430,000 illegal immigrants in
the UK in 2001 (the average of a wide range) based on a number of indirect estimates. In March 2009, a study at the
London School of Economics estimated that the number lay between 524,000 and 947,000 with a midpoint of 725,000.
Points Based System
12. No attempt has been made to predict the impact of this new immigration system. The government's own assessment is
that it might reduce net immigration by about 5%.
Long-term assumption.
13. The result of all this deliberation is a long-term assumption of net inflow to the UK of 190,000 per year. Under normal circumstances, it would seem safe to assume that this long-term assumption would under-estimate the actual out-turn, as all the recent ones have done. But we are not in normal circumstances and it seems likely that the economic crisis will reduce labour migration to the UK and possibly encourage some immigrant workers to leave although the record shows that any such effect is likely to be temporary. Furthermore, apart from the post 2004 influx of East Europeans, most immigrants to the UK in recent decades have not been labour migrants but dependants, spouses, etc. Their migration is less likely to be strongly affected by economic trends.
14. Finally it is important to remember that immigration can go down as well as up, as it has recently in Germany and the Netherlands. Although it is easier to encourage immigration than to deter it, immigration policy can have a powerful effect on inflows. Economic crisis apart, almost all components of immigration to the UK have been increasing. The 2006 assumption of 190,000 shows what happens if policies and circumstances continue as they are. For that assumption not to be realised, very substantial policy changes will have to be made
Conclusion
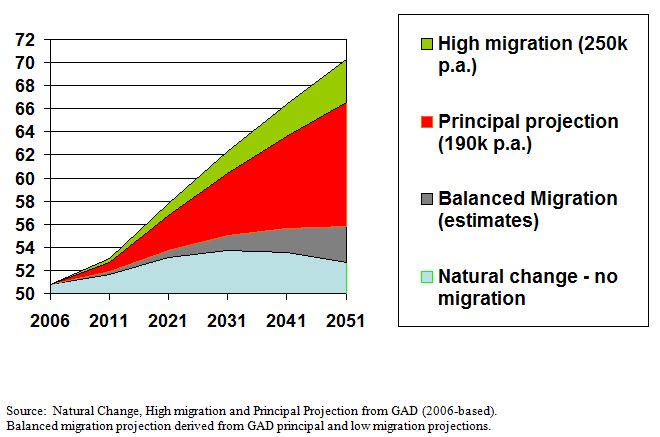
15. As will be apparent, the ONS make a serious and detailed effort to reach the most plausible assumptions possible. In
2007 the ONS published a study of the accuracy of their population projections over the past 50 years. At the 20 year
range the average error was about 2.5%.[5] The importance of getting it right is illustrated in the following diagram which
shows the effect of different immigration assumptions on population projections for England (not the UK).
Footnotes
- Population Trends Spring 2008 pp13-14
- Glover, S., C. Gott, et al. (2001). Migration: an economic and social analysis. Home Office Research and Development Directorate Occasional Paper No 67. London, Home Office.
- Migrationwatch Briefing Paper 1.21
- www.statistics.gov.uk/downloads/theme_population/Provisional_IPS_vs_TIM.pdf
- Population Trends 128 Summer 2007 "Fifty years of UK national population projections." Page 14