Foreign Students – How Many Have Left?

14 October, 2013
Summary
1. The most recent statistics included a new data set which for the first time gives an indication of the number of non-EU students who left the UK in 2012. This short note explains what this new information tells us.
Existing Data
2. Prior to 2012 the International Passenger (IPS) Survey failed to capture the number of students departing from the UK every year. Previously, the IPS asked departing migrants the purpose of their departure but not the category in which they had arrived. Many of those students who were returning home are likely to have said that they were returning to work and therefore showed up as departing workers thus distorting the picture. Migration Watch UK drew attention to this lacuna in 2009 and there is now an additional question in the IPS which asks those who are departing for their original purpose in coming to the UK, e.g. for study or for work. We now have one year’s worth of data on the number of people who left the UK in 2012 and who initially came for study.
New Data
3. The IPS estimates that in 2012 49,000 non-EU citizens who had arrived as students left the UK.[1] This is much fewer than was anticipated by many, as the Migration Observatory has conceded:
“…the outflows among student immigrants were lower than one might have expected, which suggests that students may make up a larger share of net migration than anticipated based on prior evidence.”[2]
4. As the graph below shows the actual inflow of non-EU students, as measured by the IPS, rose considerably after 2008 when the Points Based System (PBS) was introduced. The red line represents the moving average of the previous five years inflow and the green line represents the theoretical outflow of 80% of the average number of students who had arrived in the previous five years; the 80% is the proportion who no longer had leave to remain, based on the Migrant Journey.[3] This line, therefore, represents the approximate number of students who should have been departing each year if, as the education lobby claims, those whose leave has expired do indeed depart. The purple point represents the estimated number of students who left the UK in 2012 – 49,000 – much lower than the theoretical figure of 109,000 that should have departed if 80% of students did, in fact, go home on the completion of their studies.[4]
Figure 1. Student Inflow, Outflow – Assumed and Actual 2003-2012
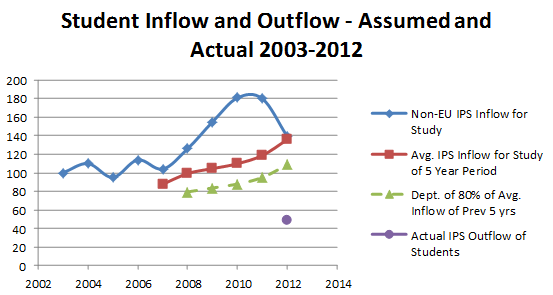
5. There are limits to what can be deduced from data for a single year, but the significance of this figure is that it is so low. It has been suggested that one reason for the low number is that some students may have left early[5] but others from previous years may have stayed longer and left in 2012. Other things being equal, these two factors should cancel out.
6. Further data will be required in order to get a fuller understanding of the behaviour of international students and their contribution to net migration. In November there will be a new set of data available which will show departures of students by year of arrival. This will add a new element to our understanding of student behaviour.
7. It is also important to remember that, as with all of the immigration statistics, these new numbers are estimates and are subject to error margins, in this case of approximately +/- 10%. This means that the number of students departing the UK in 2012 could be anywhere in the region of 44,000 to 55,000. Furthermore there were as many as 14,000 non-EU migrants who departed in 2012 who did not state a reason for why they originally came to the UK.
Reasons for the Low Outflow of students
8. There are various reasons why the departure of students might be lower than many anticipated. A step change in the length of time a student can remain in the UK would depress outflows for a period. Students could have stayed on legally for further studies, to work or to marry.
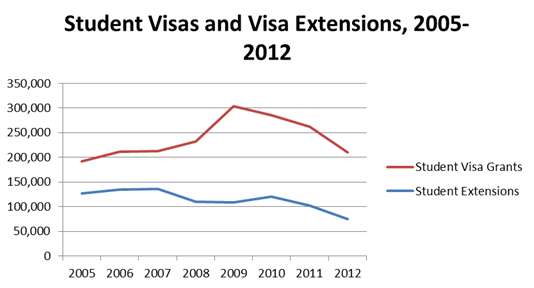
9. There has always been a three year limit on undergraduate study and that remains the case. [6] However there was no time limit on above degree level study. In theory a student was able to study part time for a qualification at post-graduate level for a number of years; this may have contributed to a delay in the number of student departures. Since 2011 students have been limited to five years study at or above degree level with the exception of students studying certain subjects that require a longer period of study.[7] Data on the number of student visa extensions (Figure 1 below) shows that from 2005 - 2011 over 100,000 students a year extended their visa, suggesting that students are spending much more time studying than the Migrant Journey suggested. This found that only one in three students had valid leave to remain as a student two years after entering the UK, falling to one in five after three years and finally just 6% after five years.[8] These figures are simply not consistent with the scale of extensions.
Figure 2. Student Visa Grants and Extensions of Student Visas, 2005-2012
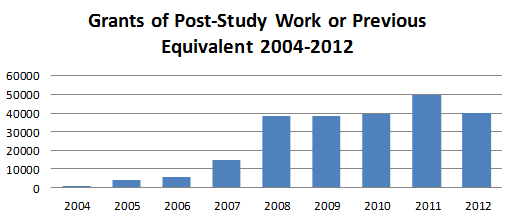
10. The rules that allowed students to stay on and work expanded rapidly between 2004 and 2008. In 2004 the Science and Engineering Graduate Scheme was introduced which allowed graduates of Maths, Engineering and Science subjects who achieved a 2:2 or above to stay on for one year to look for work. Two years later the scheme was expanded to include Masters and PhD graduates in any discipline. One year later in 2007 the scheme was expanded again to include all graduates with any grade as well as those with a post graduate qualification to stay for one year in search of work. Finally in 2008 the Tier 1 Post Study Work (PSW) visa was introduced which granted all graduates of any subject and any grade the right to stay on in the UK for two years to find work. The number of students staying on through these schemes increased significantly, as the bar chart below demonstrates.
Figure 3. Grants of Post Study Work Visas (and Previous Equivalent)
11. Students are also able to switch their visas directly into a work visa. There is data on extensions of stay by previous category for 2011 and 2012 which shows that only 3,500 in each year switched from study into a work category other than PSW.
12. In addition to those switching directly, some will have switched from a PSW visa into a work category. Again the data is limited: in 2011 11,000 PSW visa holders switched into another work category, mainly the Tier 1 High Value Migrant route which has since been closed. In 2012 almost 6,000 PSW holders switched into another work category, almost all of which were Tier 2 General.
13. Some students will switch into a family category, but not on a scale that would depress outflows significantly. For example just over 4,000 students switched into the family route in 2012, a fall from the previous year when 5,500 switched into this route.
14. A significant factor in the low outflows is likely to be the result of some students overstaying their visa illegally. There has been considerable abuse of the Tier 4 route since it was introduced in 2008 and bogus students are likely to have stayed on. The number is not known, however, because departure data is not linked to the visa databases.
Conclusion
15. There are now strong indications that students are more permanent than previously thought. Extensions for study and switching to work visas have taken place on a considerable scale and there is strong evidence of abuse in some source countries. The recent evidence suggests that students have become a significant element in net migration. Clearly, there can be no question of removing them from the net migration statistics.
Footnotes
- The number of non-EU migrants who left in 2012 who originally came as students can be found in Table 4 of the ONS, Long Term International Migration Estimates, Year Ending December 2012, Data Tables, URL: http://www.ons.gov.uk/ons/.../august-2013/provisional-long-term-international-migration--ltim--estimates-dec-2012.xls
- Migration Observatory, ‘Untangling the net: Understanding why migrants come and go’, August 2013, URL: http://www.migrationobservatory.ox.ac.uk/commentary/untangling-net-understanding-why-migrants-come-and-go
- The Home Office have now conducted three studies into migrant activity in the immigration system. The first Migrant Journey study looked at all those granted visas in 2004 and tracked their progress through the system for five years. The study showed the number of people who remained in the immigration system and those with no leave to remain. The study did not however demonstrate that those with no legal right to remain had actually left the country. The study also analysed the cohort of people granted settlement in 2009 and established their initial reason for migrating to the UK.
- The average inflow of students between 2006 and 2010 was 136,000. If 80% of these did go home then the outflow of students in 2012 would have been 109,000.
- The Migration Observatory, ‘Untangling the Net: Understanding why migrants come and go’, August 2013, URL: http://www.migrationobservatory.ox.ac.uk/commentary/untangling-net-understanding-why-migrants-come-and-go
- House of Commons Standard Note, ‘Immigration: international students and Tier 4 of the points-based system’, SN/HA/05349, July 2010, URL: http://www.parliament.uk/briefing-papers/SN05349.pdf p. 3.
- Show -6 more...
- The number of non-EU migrants who left in 2012 who originally came as students can be found in Table 4 of the ONS, Long Term International Migration Estimates, Year Ending December 2012, Data Tables, URL: http://www.ons.gov.uk/ons/.../august-2013/provisional-long-term-international-migration--ltim--estimates-dec-2012.xls
- Migration Observatory, ‘Untangling the net: Understanding why migrants come and go’, August 2013, URL: http://www.migrationobservatory.ox.ac.uk/commentary/untangling-net-understanding-why-migrants-come-and-go
- The Home Office have now conducted three studies into migrant activity in the immigration system. The first Migrant Journey study looked at all those granted visas in 2004 and tracked their progress through the system for five years. The study showed the number of people who remained in the immigration system and those with no leave to remain. The study did not however demonstrate that those with no legal right to remain had actually left the country. The study also analysed the cohort of people granted settlement in 2009 and established their initial reason for migrating to the UK.
- The average inflow of students between 2006 and 2010 was 136,000. If 80% of these did go home then the outflow of students in 2012 would have been 109,000.
- The Migration Observatory, ‘Untangling the Net: Understanding why migrants come and go’, August 2013, URL: http://www.migrationobservatory.ox.ac.uk/commentary/untangling-net-understanding-why-migrants-come-and-go
- House of Commons Standard Note, ‘Immigration: international students and Tier 4 of the points-based system’, SN/HA/05349, July 2010, URL: http://www.parliament.uk/briefing-papers/SN05349.pdf p. 3.
- Examples of subjects that exclude a student from the five year time on their student visa are Architecture, Medicine, Dentistry, Veterinary Medicine and Science, certain Music courses and Law where the student goes on to study for their LPC or BPTC. There is also an exception for those studying for a PhD See p. 16 of Home Office, Tier 4 of the Points Based System – Policy Guidance, July 2013, URL: http://www.ukba.homeoffice.gov.uk/sitecontent/applicationforms/pbs/Tier4migrantguidance.pdf
- Home Office, Migrant Journey.